 Example of Bootstrapping
This example uses the Car Physical Data.jmp sample data table. A tire manufacturer wants to predict an engine’s horsepower from the engine’s displacement (in3). The company is most interested in estimating the slope of the relationship between the variables. The slope values help the company predict the corresponding change in horsepower when the displacement changes.
|
1.
|
|
2.
|
Select Analyze > Fit Y by X.
|
|
3.
|
|
4.
|
|
5.
|
Click OK.
|
|
6.
|
Select Fit Line from the Bivariate Fit red triangle menu.
|
|
7.
|
|
8.
|
|
9.
|
Right-click the Estimate column in the Parameter Estimates report and select Bootstrap (The Bootstrap Option).
|

The column that you right-click is relevant when the Split Selected Column option is selected. For more information, see Bootstrapping Window Options.
|
10.
|
Type 1000 for the Number of Bootstrap Samples.
|
|
11.
|
|
12.
|
Click OK.
|
|
13.
|
In the Bootstrap Results table, run the Distribution script.
|
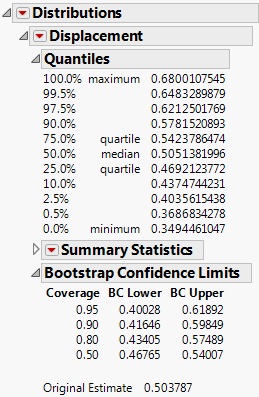
The estimate of the slope (step 6) is 0.504. Based on the bootstrap results for 95% coverage, the company can estimate the slope to be between 0.40028 and 0.61892. When the displacement is changed by one unit, with 95% confidence, the horsepower changes by some amount between 0.40028 and 0.61892. The bootstrap confidence interval for the slope (0.400 to 0.619) is slightly wider than the confidence interval (0.425 to 0.583) obtained using the usual regression assumptions in step 7 and step 8.
Note: The BC Lower and BC Upper columns in the Bootstrap Confidence Limits report refer to bias-corrected intervals. See Bias-Corrected Percentile Intervals.