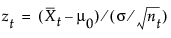
where Xt is the tth subgroup average, and nt is the tth subgroup sample size. If the subgroup samples consist of individual measurements xt, the term zt simplifies to the following computation:
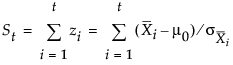
where the sequence St cumulates standardized deviations of the subgroup averages from the target mean μ0.
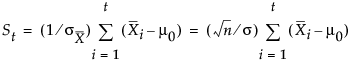
In many applications, the subgroup sample sizes ni are constant (ni = n), and the equation for St can be simplified, as follows:
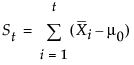
which is scaled in the same units as the data. In this case, the procedure rescales the V-mask parameters h and k to  and
and  , respectively. Some authors use the symbols F for k' and H for h'.
and , respectively. Some authors use the symbols F for k' and H for h'.If the process is in control and the mean μ is at or near the target μ0, the random walk model applies. Therefore, the points might wander away from zero, but they will not exhibit a large trend since positive and negative displacements from μ0 tend to cancel each other. If μ shifts in the positive direction, the points exhibit an upward trend, and if μ shifts in the negative direction, the points exhibit a downward trend.