|
1.
|
|
2.
|
|
3.
|
|
4.
|
Select Analyze > Quality and Process > Control Chart Builder.
|
|
5.
|
|
6.
|
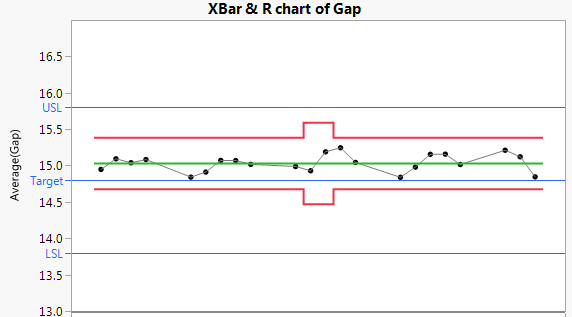
The control chart indicates that Gap is stable over time. Because Gap has the Spec Limits column property, a Process Capability Analysis report appears to the right of the control chart.
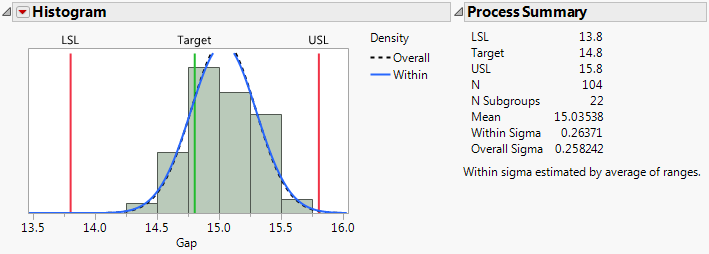
The histogram and fitted normal blue curve suggest that the distribution of Gap is approximately normal. Although the process is stable, the distribution of Gap is shifted to the right of the specification range.
The estimates of out of specification product given in the Nonconformance report provide a direct measure of process performance. The PPM values in the Nonconformance report indicate that Gap hardly ever falls below the lower specification limit (1.4 parts per million). However, the number of parts for which Gap falls above the upper specification limit is 1869.0 parts per million.
|
1.
|
Select Analyze > Quality and Process > Process Capability.
|
|
2.
|
|
3.
|
Open the Process Subgrouping outline.
|
|
4.
|
|
5.
|
Click Nest Subgroup ID Column.
|
By default, the Within-Subgroup Variation Statistic selection is set to Average of Unbiased Standard Deviations. In the Control Chart Builder example (Process Capability through Control Chart Builder), subgroup ranges were used.
|
6.
|
Click OK.
|
The report is the one obtained using Control Chart Builder, except that the Within Sigma is based on average standard deviations rather than average ranges. See Histogram in Process Capability Analysis for Gap and Capability Indices and Nonconformance Report.
The following example shows a case where the overall variation differs from the within variation because the process is not stable. It uses the Coating.jmp data table from the Quality Control folder of Sample Data (taken from the ASTM Manual on Presentation of Data and Control Chart Analysis). The process variable of interest is the Weight column, grouped into subgroups by the Sample column.
|
1.
|
|
2.
|
Select Analyze > Quality and Process > Process Capability.
|
|
3.
|
|
4.
|
Open the Process Subgrouping outline.
|
|
5.
|
Select Sample in the left side column list box.
|
|
6.
|
Select Weight in the right side column list box.
|
|
7.
|
Click Nest Subgroup ID Column.
|
|
8.
|
Click OK.
|
|
9.
|
|
10.
|
Click OK.
|
|
11.
|
|
12.
|
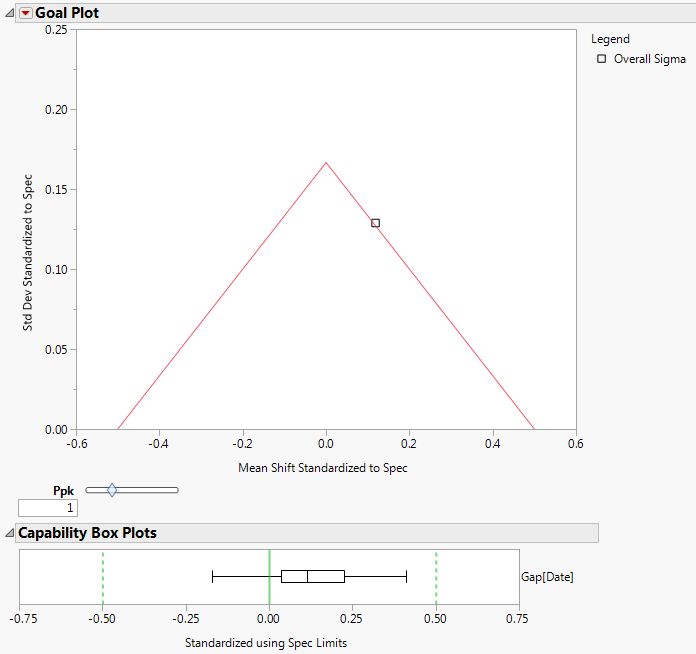
Process Capability Report for Coating.jmp Data
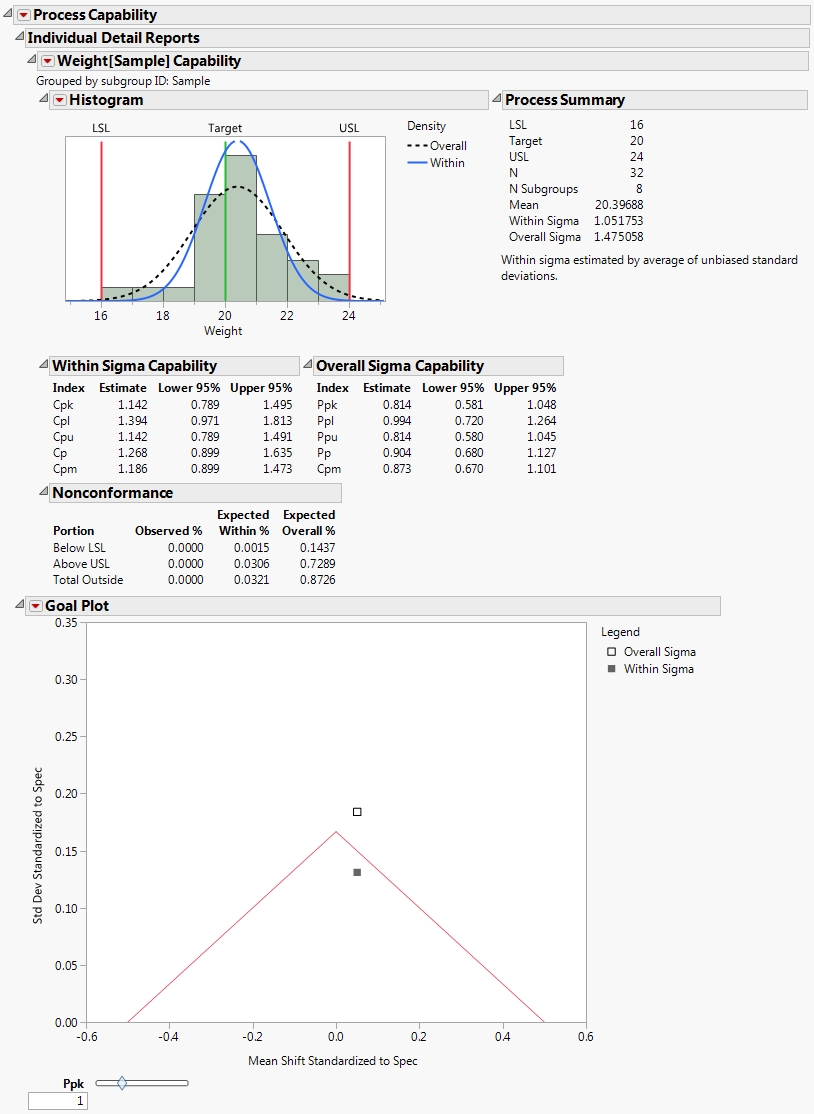
Process Capability Report for Coating.jmp Data shows the resulting Process Capability report. The Goal Plot shows two points representing the mean shift and standard deviation standardized to the specification limits. The point labeled Overall Sigma is calculated using the overall sample standard deviation. The point labeled Within Sigma is calculated using a within-subgroup estimate of the standard deviation.
The point calculated using Overall Sigma is outside the goal triangle corresponding to a Ppk of 1. This indicates that the variable Weight results in non-conforming product.
However, the point calculated using Within Sigma is inside the goal triangle. This indicates that, if the process were stable, Weight values would have a high probability of falling within the specification limits.
Use Control Chart Builder to determine whether the Weight measurements are stable.
|
1.
|
Select Analyze > Quality and Process > Control Chart Builder.
|
|
2.
|
|
3.
|
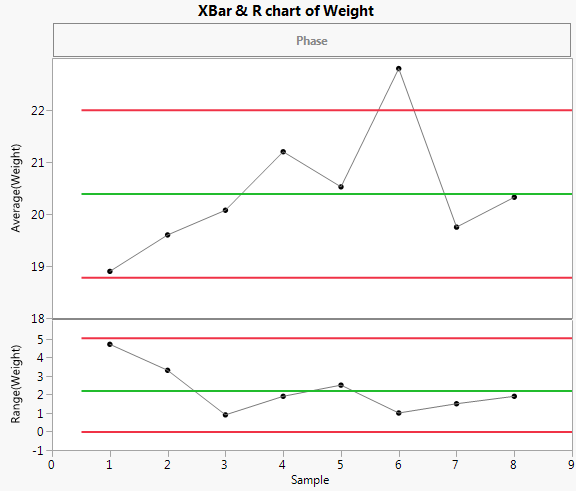
The control chart indicates that the Weight measurements are unstable. The process is affected by special causes and is unpredictable. This makes the interpretation of capability indices and nonconformance estimates highly questionable. Even estimates based on Overall Sigma are questionable, because the process is not predictable.
The histogram in Process Capability Report for Coating.jmp Data shows the distribution of the Weight values with normal density curves using both sigma estimates superimposed over the histogram. The normal curve that uses the Overall Sigma estimate is flatter and wider than the normal curve that uses the Within Sigma estimate. This is because the estimate of Overall Sigma is inflated by the special causes that make the process unstable. If the process were stable, the narrower normal curve would reflect process behavior.
Note: The Individual Detail Reports Cutoff preference determines whether the Individual Reports appear by default. If the preference is enabled, the Individual Reports appear by default if the number of process variables is less than or equal to the number specified in the preference. You can change this preference in Preferences > Platforms > Process Capability.