Scatterplots and other such graphs can help you visualize relationships between variables. Once you have visualized relationships, the next step is to analyze those relationships so that you can describe them numerically. That numerical description of the relationship between variables is called a model. Even more importantly, a model also predicts the average value of one variable (Y) from the value of another variable (X). The X variable is also called a predictor. Generally, this model is called a regression model.
Note: Only the basic platforms and options are covered here. For complete details and explanations of all platform options, see Basic Analysis, Essential Graphing, and the books listed in About This Chapter.
Relationship Types shows the four primary types of relationships.
|
Logistic regression is an advanced topic. See the Basic Analysis book.
|
This example uses the Companies.jmp data table, which contains financial data for 32 companies from the pharmaceutical and computer industries.
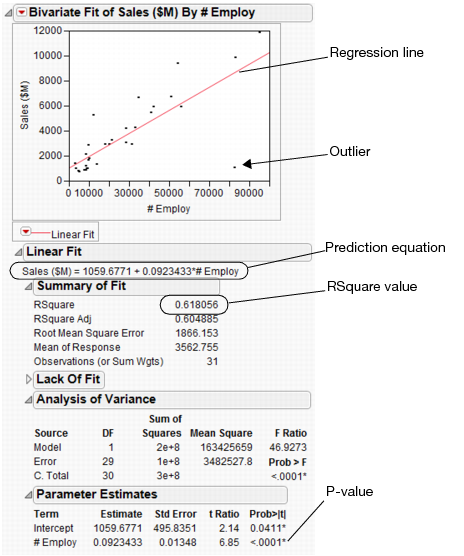
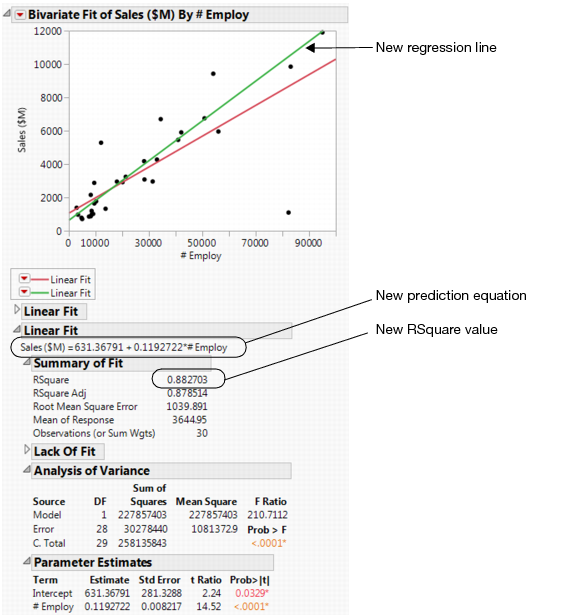
First, create a scatterplot to see the relationship between the number of employees and the amount of sales revenue. This scatterplot was created in Creating the Scatterplot in Visualizing Your Data. After hiding and excluding one outlier (a company with significantly more employees and higher sales), the plot in Scatterplot of Sales ($M) versus # Employ shows the result.
To predict the sales revenue from the number of employees, fit a regression model. From the red triangle for Bivariate Fit, select Fit Line. A regression line is added to the scatterplot and reports are added to the report window.
|
•
|
Since the RSquare value in this example is large, this confirms that a prediction model based on the number of employees can predict sales revenue. The RSquare value shows the strength of a relationship between variables, also called the correlation. A correlation of 0 indicates no relationship between the variables, and a correlation of 1 indicates a perfect linear relationship.
|
|
2.
|
|
3.
|
Using the results in Comparing the Models, the data analyst can make the following conclusions:
The prediction for the first model was $7499.68, so this model predicts a higher sales total by $1461.69.
This example uses the Companies.jmp data table, which contains financial data for 32 companies from the pharmaceutical and computer industries.
|
1.
|
|
2.
|
If you still have the Companies.jmp sample data table open, you might have rows that are excluded or hidden. To return the rows to the default state (all rows included and none hidden), select Rows > Clear Row States.
|
|
3.
|
|
4.
|
|
5.
|
|
6.
|
Click OK.
|
|
2.
|
|
3.
|
|
4.
|
To re-create the plot without the outlier, select Script > Redo Analysis from the red triangle menu for Oneway Analysis. You can close the original Scatterplot window.
|
|
‒
|
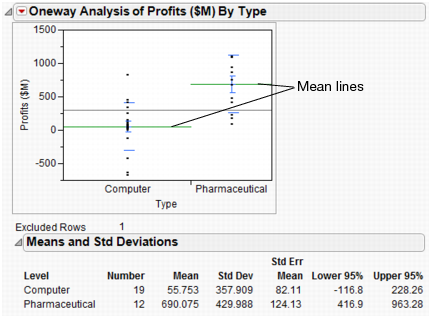
Display Options > Mean Lines. This adds mean lines to the scatterplot.
|
|
‒
|
Means and Std Dev. This displays a report that provides averages and standard deviations.
|
To perform the t-test, select Means/Anova/Pooled t from the red triangle for Oneway Analysis.
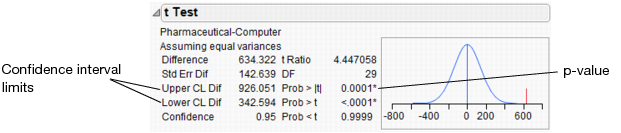
Use the confidence interval limits to determine how much difference exists in the profits of both types of companies. Look at the Upper CL Dif and Lower CL Dif values in t Test Results. The financial analyst concludes that the average profit of pharmaceutical companies is between $343 million and $926 million higher than the average profit of computer companies.
If you have categorical X and Y variables, you can compare the proportions of the levels within the Y variable to the levels within the X variable.
This example continues to use the Companies.jmp data table. In Comparing Averages for One Variable, a financial analyst determined that pharmaceutical companies have higher profits on average than do computer companies.
|
1.
|
|
2.
|
If you still have the Companies.jmp data file open from the previous example, you might have rows that are excluded or hidden. To return the rows to the default state (all rows included and none hidden), select Rows > Clear Row States.
|
|
3.
|
|
4.
|
|
5.
|
|
6.
|
Click OK.
|
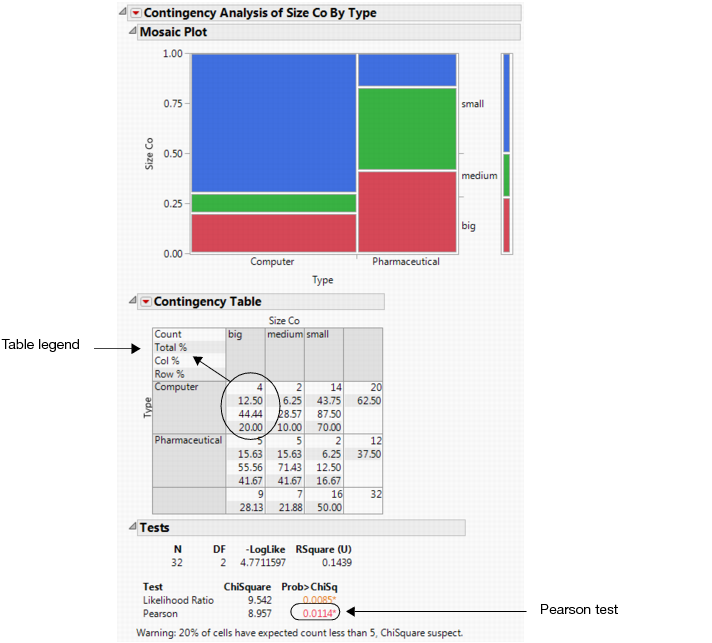
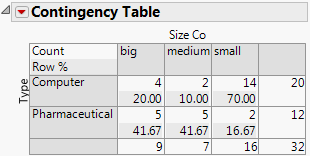
The Contingency Table contains information that is not applicable for this example. From the red triangle menu for Contingency Table deselect Total % and Col % to remove that information. Updated Contingency Table shows the updated table.
To answer this question, use the p-value from the Pearson test in the Tests report. See Company Size by Company Type. Since the p-value of 0.011 is less than the significance level of 0.05, the financial analyst concludes the following:
|
•
|
The percentages differ in the broader population.
|
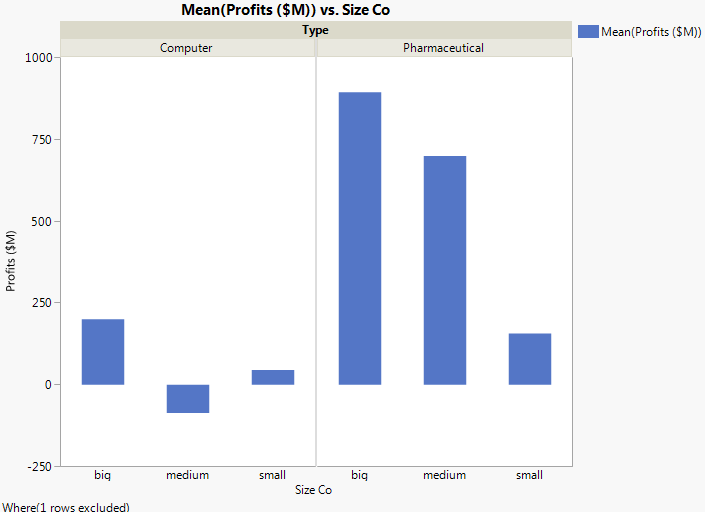
The section Comparing Averages for One Variable, compared averages across the levels of a categorical variable. To compare averages across the levels of two or more variables at once, use the Analysis of Variance technique (or ANOVA).
|
1.
|
|
2.
|
|
3.
|
|
4.
|
|
5.
|
|
6.
|
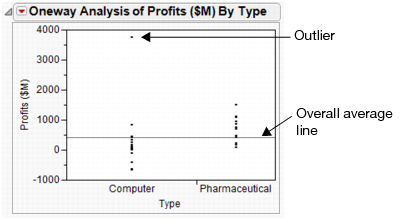
Right-click on the outlier to select it, and then select Row Exclude. The point is removed, and the scale of the graph automatically updates.
|
|
1.
|
Return to the Companies.jmp sample data table that has the data point excluded. See Discovering the Relationship.
|
|
2.
|
|
3.
|
|
4.
|
|
5.
|
|
6.
|
From the Emphasis menu, select Effect Screening.
|
|
7.
|
Select the Keep dialog open option.
|
|
8.
|
Click Run. The report window shows the model results.
|
To decide whether the differences in profits are real, or due to chance, examine the Effect Tests report.
The Effect Tests report (see Effect Tests Report) shows the results of the statistical tests. There is a test for each of the effects included in the model on the Fit Model window: Type, Size Co, and Type*Size Co.
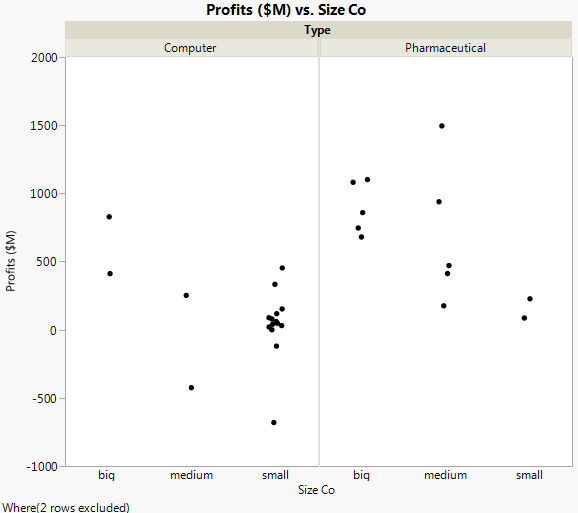
First, look at the test for the interaction in the model: the Type*Size Co effect. Graph with Outlier Removed showed that the pharmaceutical companies appeared to have different profits between company sizes. However, the effect test indicates that there is no interaction between type and size as it relates to profit. The p-value of 0.218 is large (greater than the significance level of 0.05). Therefore, remove that effect from the model, and re-run the model.
|
2.
|
|
3.
|
Click Run.
|
The section Using Regression with One Predictor showed you how to build simple regression models consisting of one predictor variable and one response variable. Multiple regression predicts the average response variable using two or more predictor variables.
This example uses the Candy Bars.jmp data table, which contains nutrition information for candy bars.
|
•
|
Use multiple regression to predict the average response variable using these three predictor variables.
|
1.
|
|
2.
|
|
3.
|
|
4.
|
|
5.
|
Click OK.
|
Continue to use the Candy Bars.jmp sample data table.
|
1.
|
|
2.
|
|
3.
|
|
4.
|
Next to Emphasis, select Effect Screening.
|
|
5.
|
Click Run.
|
The Actual by Predicted Plot shows the actual calories versus the predicted calories. As the predicted values come closer to the actual values, the points on the scatterplot fall closer around the red line. See Actual by Predicted Plot. Because the points are all very close to the line, you can see that the model predicts calories based on the chosen factors well.
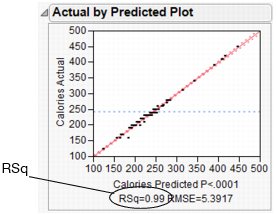
Another measure of model accuracy is the RSq value (which appears below the plot in Actual by Predicted Plot). The RSq value measures the percentage of variability in calories, as explained by the model. A value closer to 1 means a model is predicting well. In this example, the RSq value is 0.99.
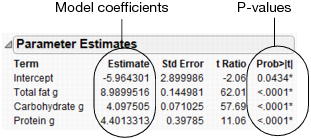
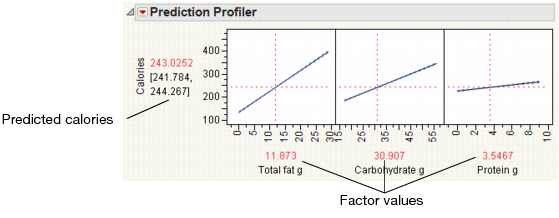
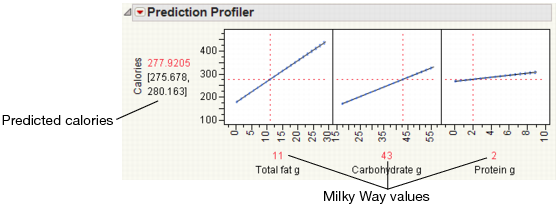
Use the Prediction Profiler to see how changes in the factors affect the predicted values. The profile lines show the magnitude of change in calories as the factor changes. The line for Total fat g is the steepest, meaning that changes in total fat have the largest effect on calories.