First you need to start a New Window, starting with its title, and then you list the items to construct inside the window. All the Display Box constructors end in “Box”. See Introduction to Display Boxes, to review what each type of display box looks like. There are similar objects that live inside of graphics frames called Display Segs (segments), and these all end in “Seg”. We have only made JSL constructors to a small subset of the various Display Boxes and Display Segs in JMP. You can nest display boxes inside each other as needed.
With an assignment, you can make a reference to a new window, so that you can send messages to it. (Throughout this document, db is a placeholder for a display box reference, dt for a data table reference, and obj for a scriptable object reference.)
This example uses Outline Boxes, H List Boxes, and Matrix Boxes to assemble a partial cheat-sheet for matrix JSL.
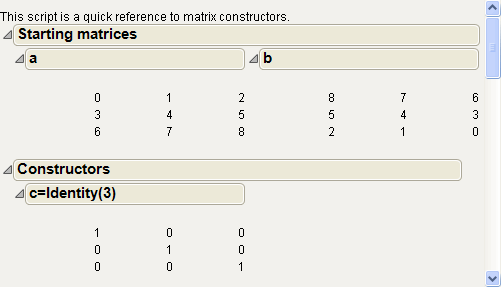
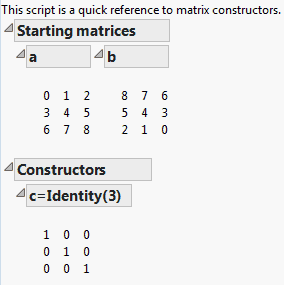
Observe how placing Matrix Boxes inside Outline Boxes is a convenient way to arrange items neatly. You could add more topics by adding more outline branches following this pattern.
The following sections describe how to add and delete display boxes from a report using Append, Prepend, Delete, and Sib Append.
Use the Append message to add a display box to the bottom of an existing display. In the script, construct a single, empty box, then <<Append boxes to it for each variable in the analysis.
The following code example assumes that there is a list of effect names in the variable effectsList, and that each one corresponds to a column in a matrix varprop. In other words, effectsList[1] is the label for varprop[0,1]; effectsList[2] is the label for varprop[0,2]; and so on.
First, an empty Outline Box containing an H List Box is made. The interior empty container is given the name hb:
Then, a for loop steps through the effectsList and adds a Number Col Box for each element of effectsList:
The Prepend message works just like Append, but adds the item at the beginning of the display box rather than at the end. If the display box is one of several that do not allow appending, then it delegates the command to a child display box that can accept the command. It is fine to apply it to the top of the tree.
Click the Click Here for curve button to add a quadratic curve to the graph.
The Delete message removes the specified display box and all its children from the report. This is useful with the Append and Prepend messages for building completely dynamic displays. In the example below, a text box is replaced with another text box. In this case, the script could have used Set Text, but many display boxes cannot change their content.
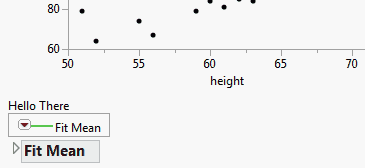
You can use the Sib Append message to add a display element to an existing tree. Refer back to the display box tree shown in View Display Tree. Under ListBox(2), you see two picture box trees. PictureBox(1) holds the bivariate scatterplot. This is easily determined by seeing the two axis boxes holding the height and weight axes. Picture Box (2) holds the Fit Mean menu, determined by seeing the green line and the Fit Mean text box.
Suppose you wanted to insert a text box in between these two boxes. We want to append a sibling to Picture Box (1), so we send it the Sib Append message:
To update a numeric column in a display box table, use the Set Values command.
To update a string column in a display box table, use the Set Values command.
The <{list}> argument specifies the new strings for the table.
Generally, JMP automatically wraps text within a Text Box. However, the default wrap point can be overridden with a Set Wrap (n) message, where n is the number of pixels to display before the wrap point.
You can also add bullet points using Bullet Point(1):
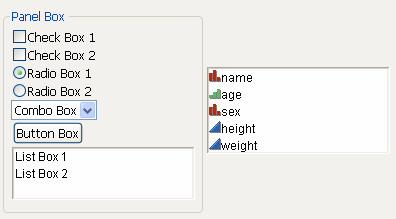
JMP has several special types of display boxes that you do not normally see in a JMP platform: Button Box, Slider Box, Range Slider Box, and Global Box. These are useful for building custom windows with interactive graphics.
Note: The chapter Scripting Graphs, shows how Handle and MouseTrap both present controls inside the graph itself.
You can also place buttons, sliders, and edit-field controls outside a graph. Each box type creates separate display boxes that need to be combined in a new window according to the rules described in Constructing Display Trees. For basic effects, you can follow the pattern in the examples shown here and postpone the detailed discussion.
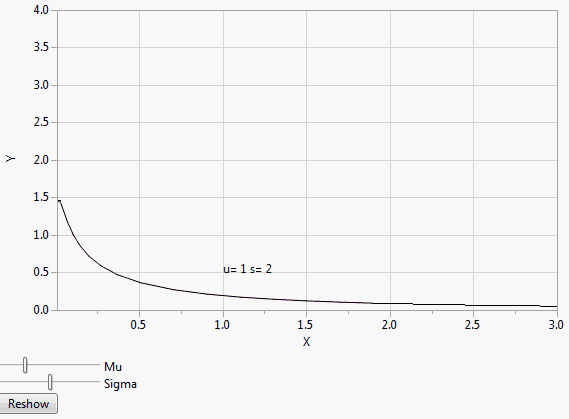
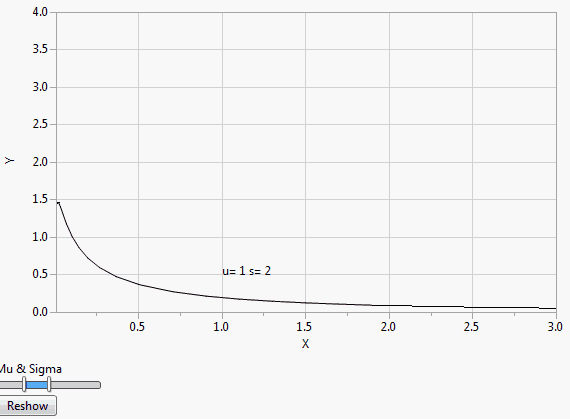
Slider Box draws a slider control for picking any value for the variable that you specify, within the range given by the min and max you specify. Any time the slider is moved, the value given by the current position of the slider is assigned to the global variable. The graph updates accordingly. Thus, Slider Box is another way to parameterize a graph.
Use Range Slider Box to draw a slider that contains two controls for picking a range of values.
Button Box draws a button with the name that you specify. Any time the button is clicked, the script executes. The button stays alive and remains available for the duration of the window. You might want to use Button Box in combination with sliders or to provide a choice to update a graph to reflect changing data conditions. You can also send a click() command to a button object at any time.
Number Edit Box creates an editable box with the specified number as the initial value. The box is interactive when combined with an object such as a date selector.
The following script sets the initial value of the Number Edit Box to 0 and the text field to 20 characters wide. <<Set Format specifies the format of the date that appears in the box and the number of characters to display. <<Set specifies the default date and its format. The user can either enter a date in the box or select the date from the pop-up calendar.
See Example of a Date Selector for a more detailed example.
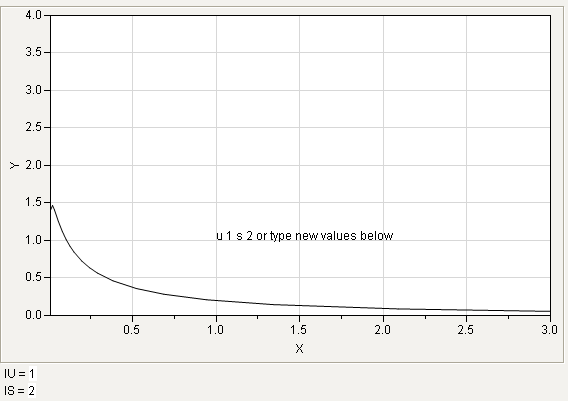
Global Box shows the name and current value of a JSL global variable. The user can assign a new value to the global variable by editing the value directly in the window and pressing ENTER or RETURN to commit the change. Graphs using the global box automatically update for the new value. If you specify an expression, such as Sqrt(4), the global box first evaluates it and then stores and displays the result, 2.
Note: When using Global Box, every time the variable is changed it remeasures, reshows, and updates the window which, depending on the number of Global Box objects, can affect the refresh rate of the window. JMP recommends avoiding numerous global boxes in deliverable scripts. Global boxes can be replaced with text boxes that the script can manually update when necessary.
The following script uses a Range Slider Box() instead of a Slider Box() to perform the same function:
Note: For Range Slider Box controls, the upper variable cannot be less that the lower variable and the lower variable cannot exceed the upper variable.
The script below is similar but uses Global Box as an editable text box instead of two Slider Box controls:
This example shows how to create an interactive calendar using Number Edit Box(). The user enters a date in the box or clicks the blue triangle to select a date from the calendar. The number appears in a text box below the number edit box.
A callback is assigned to the f variable. In the callback, this refers to the number edit box, the box that calls the function later. Referring to this prevents the need for using the numbox variable within the callback. The <<Get message is sent to the this argument to get the specified date. <<Set Text displays the date in the text box.
Note: The Dialog() function, which creates modal windows, was deprecated in JMP v10 and may not work in future versions of JMP. Use the New Window() function with the Modal argument in place of the Dialog() function.
See Modal Windows for more details on using New Window(). See also the JSL Syntax Reference book for syntax details.
The following controls are available for boxes in New Window().
Used to add space around the displaybox argument. Left, Right, Top, and Bottom add space around the displaybox argument. Sides draws border around the box, as described in Border Box Sides Argument Values. Additional effects can also be applied to the borders using Sides, as described in Border Box Sides Argument Additional Effects. To add both an effect and a border, add the two numbers.
You can also send the message Open Next Outline as a script command, which causes the next outline box to open. If you are sending more than one message to the button box, this must be the first command listed.
The "-" in this example creates a menu separator. The separator counts as an item in the list. If you select c from the menu, 4 is returned, not 3.
The following example shows how to get the user’s selection by sending <<Get Selected to the check box. Each selection is printed to the log.
Col List Box (<Data Table (<name>), <All>, <width(n)>, <maxSelected(n)>, <nlines(n)>, <script>, <MaxItems(n)),<MinItems(n)>, <character | numeric>, <onChange(expression)>)
All specifies that all columns in the current data table should be included. Width is measured in pixels. MaxSelected is the maximum number of items that might be selected in the list box. Nlines is the number of lines to display in the box.
You can send a Get Items message to a col list box to retrieve a list of all columns selected. Here is an example script showing Get Items in use:
The Editable argument allows the user to enter text in the combo box. The following script creates a new window and an editable combo box with the list items “one”, “two”, and “three”. The script prints the selected item name and index number to the log.
Note that closing the window for an editable combo box can produce unexpected results. On Windows, the Print() script runs after you select an item from the list or enter the item name. On Macintosh, the Print() script runs after you select an item from the list or enter the item name and then press Return.
For cross-platform compatibility, include !Is Empty to test for an existing combo box before running the script.
The Journal Box function, like other functions ending in Box, constructs a Display Box appropriate for gluing together with other Display Boxes to create a display in a window.
box = Journal Box("journal text")
where "journal text" is text that has been extracted from a journal file.
Since journal text has lots of rules about what boxes can be with other boxes, we recommend that the only way that you obtain journal text is to highlight an area, use the Journal command to make a journal containing only that item, save it. Now open the file in a text editor (you might have to change the file extension to do this). Then paste it into your script as the Journal Box argument. We highly recommend that you use the "\[ ... ]\" quoting mechanism so that you do not have to escape double quotes within the journal text.
cross tabs(0.277777, 0.4444444, 0.72222, 0.83333, 0.944444, 1, 0.136366, 0.31818, 0.63636, 0.863636,
Display boxes specified in the displaybox arguments are drawn in nc columns. Optional spacing can be specified, in pixels, for the space between columns.
Width is measured in pixels. Max selected is the maximum number of items that might be selected in the list box. Nlines is the number of lines to display in the box, with a default value of 3.
Append always adds the list to the end of the list box. Insert adds the list after the position specified.
You can have two mutually exclusive list boxes, so that the item you select in one box is deselected when you select an item in the other box. Use Clear Selection to deselect the item.
Number Col Box("title", numbers)
Number Edit Box(value)
Encloses the displaybox argument in a labeled border.
Creates a red triangle menu. The following example stores a command list in a variable, and then uses Popup Box to display the items.
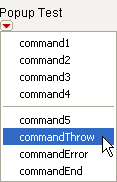
Note that you can also disable and re-enable the menu using the message <<enable(Boolean). An argument of 1 turns the menu on, and an argument of 0 turns the menu off. Using the previous example, you would assign the popup box to a variable, and then send messages to it:
Draws a slider control for picking any value for the variable, within the minimum and maximum range that you specify. Any time the slider is moved, the value given by the current position of the slider is assigned to the global variable. The graph updates accordingly. Thus, Slider Box is another way to parameterize a graph.
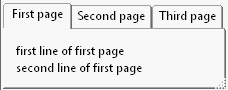
You can specify which tab should be selected by sending <<SetSelected(n), where n is the tab number, to the tab box object.
The <<Set Style message lets you select the visual appearance of the tab box. The default value is tab. Other options include:
|
•
|
combo creates a combo box.
|
|
•
|
outline creates an outline node.
|
|
•
|
vertical spread displays the tab title vertically.
|
|
•
|
horizontal spread displays the tab title horizontally.
|
|
•
|
minimize size bases the tab style on the width of the tab title. In the following script, the first tab title is fairly long.
|
Minimizing the size of the tab box converts the tab box into a combo box. Default Tab Box (Left) and Minimized Tab Box (Right) compares the default and minimized tab boxes.

Tip: Set Style() works for both bare words and quoted words. However, you cannot assign the style to a variable and then pass the variable as the argument.
To delete a tab box, send it the message <<Delete Box. Note that this will delete the entire display box (all tabs) not just a single tab.
Text Box(“text”)
Note: Rotated text boxes support Markup text except for larger text boxes with multiple lines, multiple formats or justifications applied.
Text Edit Box (“text”)
For example, the following script sends a message to the log each time the text edit box is changed.
The following script produces the Text Edit Box shown in Text Edit Box with Placeholder Text. The Hint() function returns "mm/dd/yyyy" and formats it as light gray text.
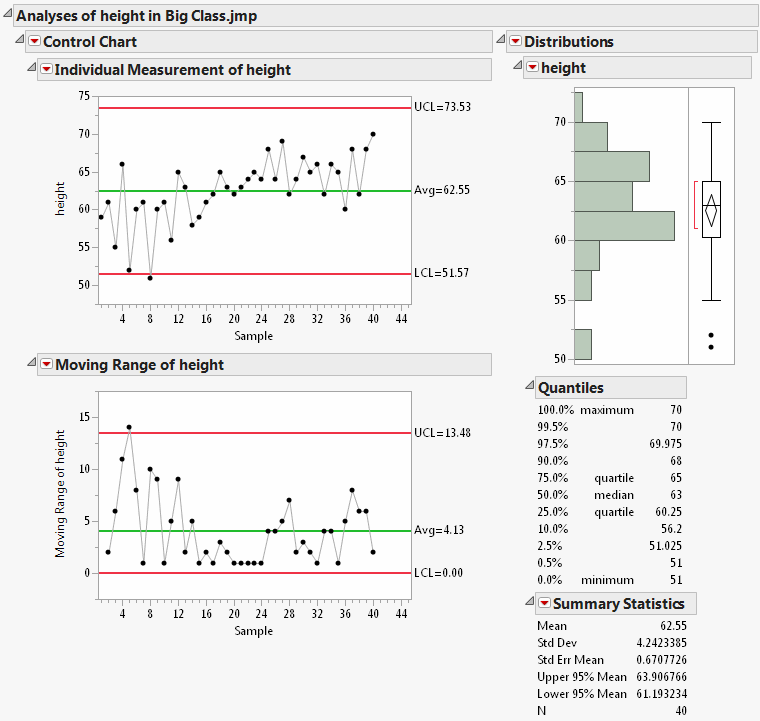
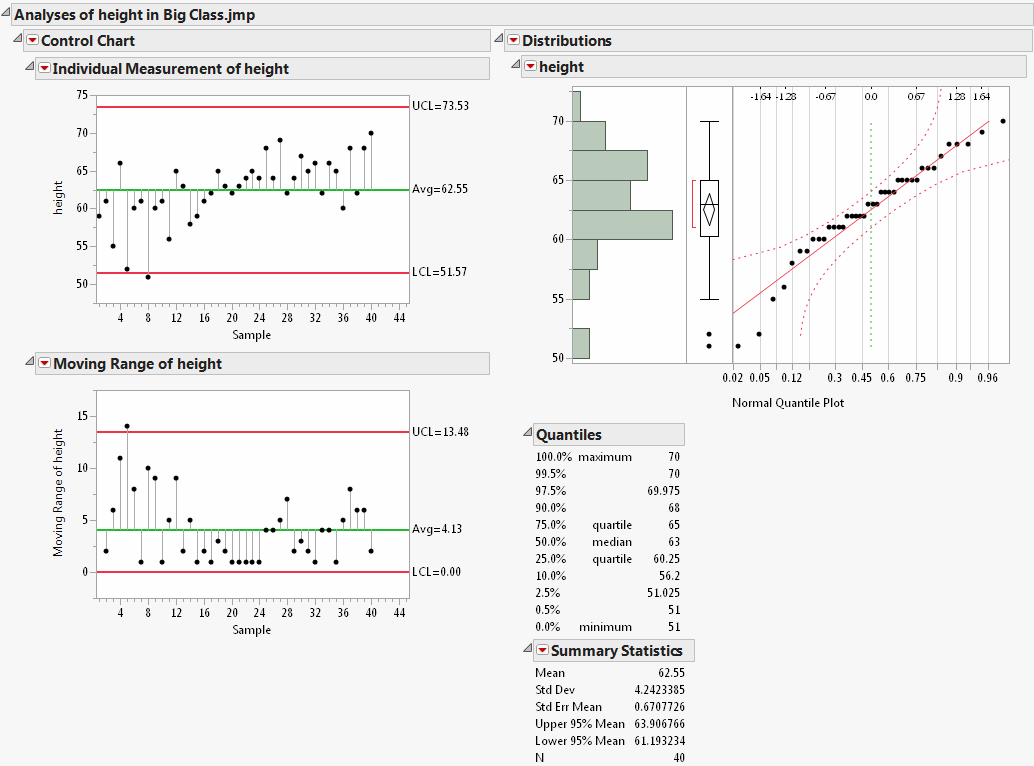
The following script generates a sample of many controls illustrated above. The Big Class.jmp sample data table is open.
You can use <<Set Selected (Item Number, <State>, <Run Script(0|1)>) command to pre-select an item. You can use this command separately to a saved display box reference, or you can specify it inline as a list box << argument.
To retrieve the selected value, use <<Get Selected, which returns the value of the selected item. << Get Selected Indices returns the index number of the selected item.
In the preceding examples, the Print expression is executed when you the <<Set Selected message is completed. To prevent the script from running, include Run Script(0) as the last argument. Run Script( 0|1 ) controls whether a display box on-change script runs after a <<Set or <<Set Selected message.
With Run Script( 1 ), the script is executed when the Set message is completed, even if the value is unchanged. (The script does not run again if the user selects the same value.) With Run Script( 0 ), the script does not run.
On most interactive display boxes, the script does not run if you leave out Run Script(). However, on List Box(), the script runs by default, which is consistent with previous behavior.
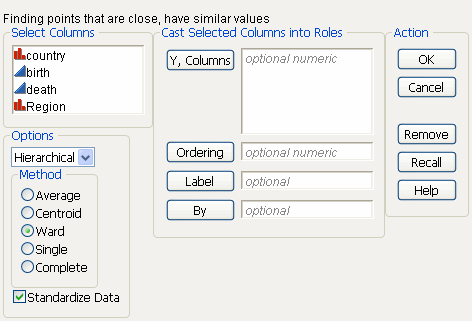
Note: Some functions (Recall and Help) are not implemented in the script, so an alert window is shown when they are clicked. In addition, switching from Hierarchical to K-Means clustering does not change anything unlike the real Cluster launch window.
Use For loops for more complex movement:
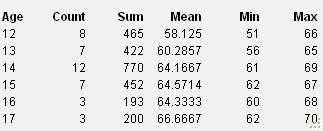
This script uses the Summarize operator to collect summary statistics on the Height column of Big Class.jmp and then uses display box constructors to show the results in a nicely formatted window.
This produces a window called “Summary Results” containing a table as shown in Producing a Customized Summary Report.
Now you can work with the window by sending messages to the reference csp. This is a display box reference, whose capabilities are similar to those of a Report for a platform. You can use multiple-argument subscripting to locate specific items within the outline tree:
Notice that this script not only assigned the whole window to a reference (csp) but also assigned the platform-launch scripts to names (cc and dist) within their display boxes. This makes it easy to route messages to the platforms. You could in turn get the reports for these and have yet another way to manipulate display boxes. The following are equivalent messages that reopen the nodes:
An example in Manipulating expressions in Programming Methods, showed how to use the SubstituteInto function to input coefficients for a quadratic polynomial into the quadratic formula and then use the formula to calculate the roots of the polynomial. That example required specifying the coefficients as arguments to SubstituteInto.
The section Modal Windows shows an example to collect coefficients from the user using a modal dialog box.
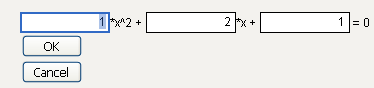
Clicking OK, displays a results window (Example: The Custom Platform's Report, left), with either the roots or an error message. Rerun the script, input 5, 4, and 5 respectively and click OK. Note that JMP displays an error message (Example: The Custom Platform's Report, right).

Sheet box lets you create a grid of plots. H Sheet Box and V Sheet Box contain display boxes and arrange them in columns and rows. The general approach is to first consider what display boxes that you want, and in what arrangement. Then, create either an H or V Sheet Box and send it a Hold message for each plot. Finally, create interior H or V Sheet Boxes and tell each one which plot it should hold.
Use a V Sheet Box to organize the window into two columns.
Send it four Hold messages, one for each plot. The order matters.
Finally, add two H Sheet Boxes to the V Sheet Box and tell each one which plot it should hold. Each H Sheet Box holds two side-by-side plots. They are held by a V Sheet Box, so the H Sheet Boxes are displayed vertically.
Sheet Part displays a previously defined plot, held by Excerpt Box. The first argument is the number of the plot, determined by the order in which you defined the plots. So this first H Sheet Box contains the Bivariate plot on the left and the Distribution on the right. {Picture Box(1)} designates which picture box from the report to display. Generally speaking, use 1.
Finally, a note on the titles for Sheet Part. If you include an empty string as the title, the sheet part’s title is the default report title. For example, “Bivariate Fit of weight By height”. You can define your own title by enter your title as the string. For example, “My Title Here”.
Note: For Sheet Part, you must include a title, either an empty string or a character string. This argument is mandatory. If you want a blank title, use a string of one or more spaces.
Suppose you start with a report, generated in this case from the Big Class.jmp data table.
To journal the report results, use the journal window message.
displaybox<<Get Picture;
The function Expr As Picture evaluates its argument and creates a picture of the expression, using the same formatting mechanism as the formula editor. If you have a literal expression as the argument, remember to enclose it in Expr() so that JMP just takes a picture of the result, rather than evaluate the expression.
|
1.
|
Incorporate it into a new Display tree, using a displayBox constructor.
|
|
2.
|
Write it to a file using Save Picture.
|