In an open script, click the Debug Script button  (or select Edit > Debug Script) to show the script in the JSL Debugger window. You can also use a keyboard shortcut:
The JSL Debugger helps identify the point at which a script causes an error or fails. Rather than commenting out portions of the script or adding Print() expressions, you can use the Debugger to find the problem.
Once the JSL Debugger appears, you can continue in this mode, or you can click the Profile JSL Script button  to move into the JSL Profiler mode. The JSL Profiler helps with optimization. You can profile your scripts during execution to see how much time is spent executing particular lines or how many times a particular line is executed.
The Debugger opens in a new instance of JMP (The Debugger Window). The original instance is inoperable until the script produces something that requires interaction. At that point, the Debugger window becomes inoperable until you perform whatever action is required. Then control is returned to the Debugger. Close the Debugger to work again in the original instance of JMP.
|
Note: If there is an error in the script, an abbreviated error message is displayed at the top of the window. Click More to see the complete error message.
|
||
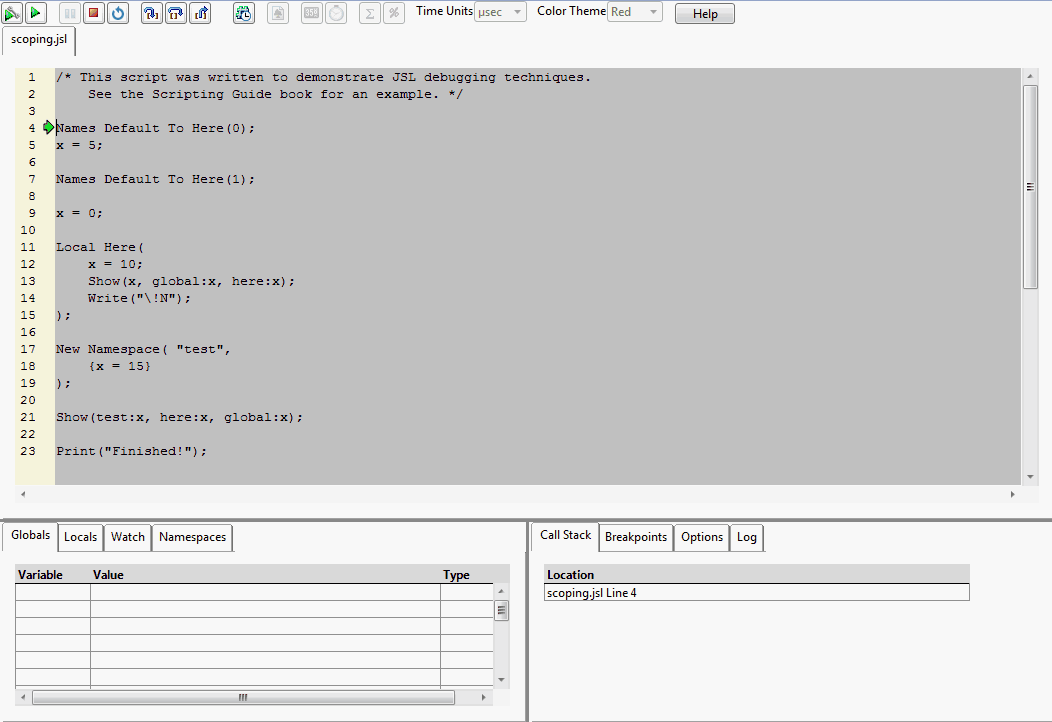
The Globals tab lists all global variables and updates their values as you step through the script. Each variable is added as it is initialized. If there are already global variables defined from running earlier scripts, they will be listed with their current values when you start the Debugger. See View Variables.
The Locals tab lists all variables by scope and updates their values as you step through the script. Select a scope in the menu. See View Variables.
If there is a particular variable or value of an expression whose values you want to watch as you step through the code, you can add them here. This is particularly useful if your script uses many variables that might be hard to watch in the Globals or Locals lists. See Work with Watches.
As namespaces are defined, they are added to the menu. Select a namespace to view any variables and their values used within the namespace. See View Variables.
Add, edit, delete, and disable or enable breakpoints. See Work with Breakpoints. You can also double-click a row on the Breakpoints tab to move the cursor to the specified line.
A breakpoint interrupts the execution of a script. Although you can step through a script line by line, this can be tedious and lengthy for a long or complex script. You can set breakpoints at places of interest and simply run the script in the Debugger. The script is run normally until a breakpoint is reached. At the breakpoint, the Debugger stops executing the script so you can look at the values of variables or start stepping line by line.
Tip: Turn on line numbers by right-clicking in the script and selecting Show Line Numbers. You can also show line numbers by default in all scripts by modifying the Script Editor preferences.
|
•
|
|
•
|
In the Debugger margin, right-click the breakpoint icon and select Clear Breakpoint.
|
|
•
|
In the Debugger margin, right-click the breakpoint icon and select Enable Breakpoint or Disable Breakpoint.
|
Suppose that a calculation in your script is incorrect, and you suspect the problem occurs when i==19. Set a conditional breakpoint for i==18. The Debugger will run until that condition is met, then you can step through the code to identify the problem.
|
1.
|
Right-click the breakpoint icon and select Edit Breakpoint.
|
|
2.
|
On the Condition tab, select Condition and enter the conditional expression.
|
|
3.
|
|
4.
|
Click OK.
|
|
1.
|
Right-click the breakpoint icon and select Edit Breakpoint.
|
|
2.
|
On the Condition tab, deselect or select Condition.
|
Right-clicking the breakpoint and selecting Edit Breakpoint provides a quick way to manage breakpoint behavior. Alternatively, select the breakpoint on the Breakpoints tab and click  . Both methods display the Breakpoint Information window, where you customize settings on the Hit Count and Action tabs.
You can control the number of times a breakpoint must be hit and when the break occurs. For example, to break when the condition is met twice, select break when the hit count is equal to and type 2 on the Hit Count tab.
You also have the option of defining a JSL expression or script that the Debugger executes when a breakpoint is hit and execution has stopped. This script is called an action. On the Action tab, enter the JSL expression to be executed.
When you right-click and select Run To Cursor, all expressions before the location of the cursor are executed. Select this option when you only want to see values up to the current line. To see values when each expression is executed, use the stepping options.
You can also assign the variables whatever value you want. For example, if you are stepping through a For() loop but are interested only in what happens starting with a particular iteration, you can assign your iterating variable that value. Step through the first part of the loop that initializes the iteration variable and then assign it the value that you want in the variable list at the bottom. Then when you step through, the loop begins executing at that point.
|
•
|
If you have run several scripts using the global scope, you might want to clear or delete global variables. This makes the list of variables in the Debugger shorter and relevant. Use the Delete Symbols() function to do so. You can also close JMP and restart to clear the space.
|
|
•
|
In the Debugger, right-click the line that you want to watch, select Add Watch, and then enter the variable name in the window.
|
|
•
|
On the Watch tab, enter the variable in an empty Variable field.
|
Breaks when the script executes the Throw() function. For example, Throw() might be enclosed in a Try() expression. The Debugger breaks on Throw() instead of continuing through the rest of the expression. This lets you identify where the problem occurred in the script and then return to debugging.
Shows a warning when you enter a breakpoint condition that contains the assignment. For example, if you have a breakpoint on x = 1 and add the condition x = 1 to the breakpoint, you are prompted to verify the assignment of x.
These settings are stored in a file named JMP.jdeb, the location of which is defined in the USER_APPDATA variable:
|
•
|
Windows 7: "/C:/Users/<username>/AppData/Roaming/SAS/JMP/<version number>/"
|
|
•
|
Macintosh: "/Users/<username>/Library/Application Support/JMP/<version number>/"
|
Note: On Windows, the paths differ based on the JMP edition. In JMP Pro, the path refers to “JMPPro”. In JMP Shrinkwrap, the path refers to “JMPSW”.
Example scripts are located in the Samples/Scripts folder.
|
1.
|
|
3.
|
Click Run.
|
|
‒
|
stringFunction is defined as a function.
|
|
‒
|
str is defined as an empty string.
|
Both variables and their types and values have been added to the Globals list. In addition, the For() loop has been evaluated up to the line with the breakpoint, shown in Set the Breakpoint.
|
‒
|
i has been assigned to 0.
|
|
‒
|
i and its value and type have been added to the Globals list.
|
|
‒
|
i has been determined to be less than or equal to 9.
|
|
‒
|
stringFunction() has not yet been called.
|
|
4.
|
Click Run again.
|
The script runs until it hits the breakpoint. The results are shown in Global Variables at First Breakpoint.
|
‒
|
stringFunction() is called, evaluated, and returns to the loop.
|
|
‒
|
i is incremented and determined to be less than or equal to 9.
|
|
‒
|
|
5.
|
Click Run again.
|
The script runs until it hits a breakpoint. The results are shown in Global Variables at Second Breakpoint.
|
‒
|
stringFunction() is called, evaluated, and returns to the loop.
|
|
‒
|
i is incremented and determined to be less than or equal to 9.
|
You can continue to click Run and watch i and str change with each iteration of the loop. Or, click Run without breakpoints to complete running the script and exit the Debugger.
Step Into, Step Over, and Step Out offer flexibility when your script contains expressions, functions, or includes other JSL files.
|
1.
|
|
3.
|
Click Step Over.
|
|
4.
|
Click Step Over again.
|
|
5.
|
Click Step Over again.
|
|
6.
|
Click Step Over.
|
|
7.
|
Continue clicking Step Over until the expression ends.
|
|
8.
|
Click Step Over to run the function without stepping into it. The Debugger runs the entire function, and returns to the line following the function call.
|
|
9.
|
Click Step Into.
|
|
10.
|
Click Step Over.
|
|
11.
|
Click Step Out.
|
The Debugger runs the rest of the included script and returns to the line following the Include() function.
|
1.
|
|
2.
|
Click Step Over.
|
The fourth line turns off Names Default To Here. If you run this script again in the same JMP session, this line resets the scoping so that the first variable that is created is in the global scope.
|
3.
|
Click Step Over.
|
A global variable named x is created. On the Globals tab, x has been added to the list, showing its value as 5 and its type as number.
|
4.
|
The global variable x is also shown here.
|
5.
|
Click Step Over twice.
|
Names Default To Here is turned on, which places the rest of the script into a Here scope. Then a new variable x is created in that scope.
Notice that the value of the global variable x has not changed.
|
6.
|
Select Here from the list on the Locals tab.
|
|
7.
|
Click Step Over.
|
A Local Here scope is created. A second Here scope is shown in the Locals list.
|
8.
|
Click Step Over.
|
A new x variable is created in this Here scope. On the Locals tab, select each of the three scopes from the list (Here, Here, and Global) to see three different x variables.
|
9.
|
Click Step Over.
|
Look in the Debugger’s log to see the output. Notice that here:x scopes to the local here, not the script window’s here.
|
10.
|
Click Step Over.
|
After writing an empty line to the log, the script exits the Local Here scope. The second Here, along with its’ x variable, has disappeared from the Locals list.
|
11.
|
Click Step Over.
|
A namespace called “test” is created, with another variable named x. Select the Namespaces tab to see it.
|
12.
|
Click Step Over and look at the log.
|
|
13.
|
Click Step Over to exit the Debugger.
|
|
1.
|
|
2.
|
Click Step Over twice.
|
The New Window expression is evaluated, and a modal window waiting for input is created. You might need to move the Debugger window to see the new modal window.
|
4.
|
Click Step Over three times and look at the log in the Debugger.
|
|
5.
|
Click Step Into to exit the Debugger.
|
|
1.
|
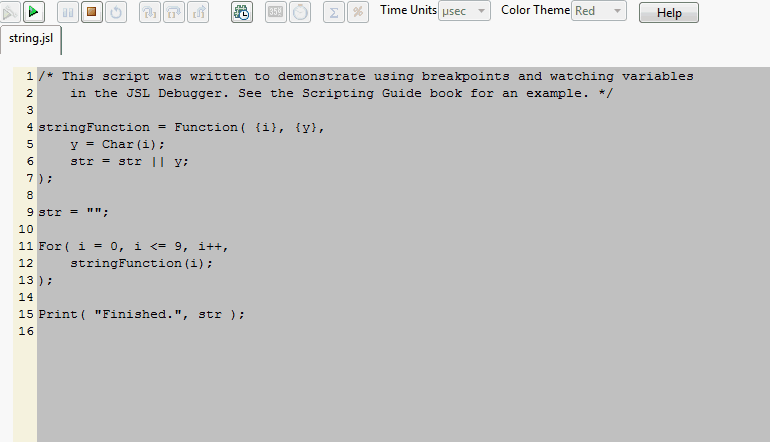
Open the string.jsl sample script.
|
|
2.
|
|
3.
|
|
4.
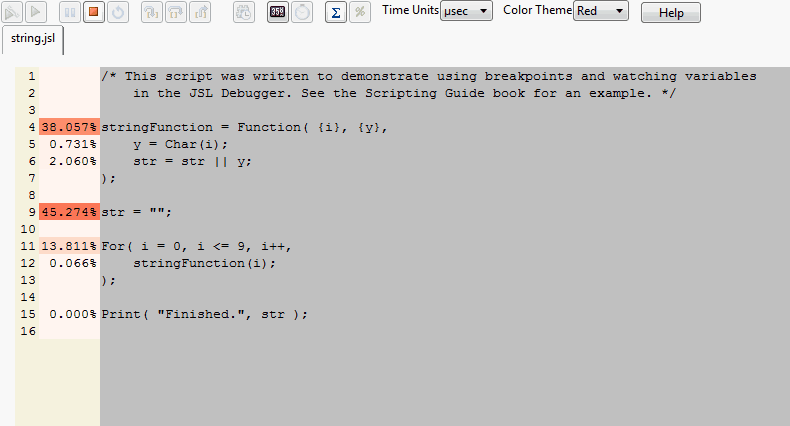
|
In the left margin, the selected statistics are displayed. Percent of time is displayed by default. Click the Show Profile by Count button  to switch to percent of statement counts instead. The left margin is color-coded to allow for quick identification of problematic performance areas.


