|
Shows or hides a Group Means report that provides the means of each covariate. Means for each level of the X variable and overall means appear.
|
|
|
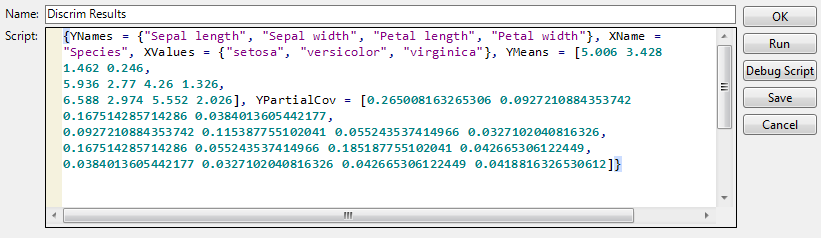
Saves a script called Discrim Results to the data table. The script is a list of the following objects for use in JSL:
|
|
|
Opens a separate window containing a Scatterplot Matrix report that shows a matrix with a scatterplot for each pair of covariates. The option invokes the Scatterplot Matrix platform with shaded density ellipses for each group. The scatterplots include all observations in the data table, even if validation is used. See Scatterplot Matrix.
|
|
Shows or hides the confusion matrices, showing actual by predicted counts, in the Score Summaries report. By default, the Score Summaries report shows a confusion matrix for each level of the categorical X. If you are using JMP Pro with validation, a matrix is given for each set of observations. If you are using JMP with excluded rows, these rows are considered the validation set and a separate Validation matrix is given. For more information, see Validation in JMP and JMP Pro.
Appends a Receiver Operating Characteristic curve to the Score Summaries report. For details about the ROC Curve, see, the Specialized Models book.
Selects rows with uncertain classifications in the data table and in report windows that display a listing by Row. An uncertain row is one whose probability of group membership for any group is neither close to 0 nor close to 1.
Saves distance, probability, and predicted membership formulas to the data table. For details, see Saved Formulas.
|
‒
|
The distance formulas are SqDist[0] and SqDist[<level>], where <level> represents a level of X. The distance formulas produce intermediate values connected with the Mahalanobis distance calculations.
|
|
‒
|
The probability formulas are Prob[<level>], where <level> represents a level of X. Each probability column gives the posterior probability of an observation’s membership in that level of X. The Response Probability column property is saved to each probability column. For details about the Response Probability column property, see the Using JMP book.
|
|
‒
|
The predicted membership formula is Pred <X> and contains the “most likely level” classification rule.
|
|
‒
|
The Wide Linear method also saves a Discrim Data Matrix column containing the vector of covariates and a Discrim Prin Comp formula. See Wide Linear Discriminant Method.
|
Shows or hides the biplot rays in the Canonical Plot and in the Canonical 3D Plot. The labeled rays show the directions of the covariates in the canonical space. They represent the degree of association, or loading, of each covariate on each canonical variable.
Colors the points in the Canonical Plot and the Canonical 3D Plot based on the levels of the X variable. Color markers are added to the rows in the data table. This option is equivalent to selecting Rows > Color or Mark by Column and selecting the X variable. It is also equivalent to right-clicking the graph and selecting Row Legend, and then coloring by the classification column.
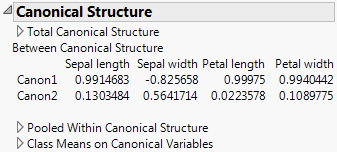
Shows or hides Canonical Structures report. See Show Canonical Structure. Not available for the Wide Linear discriminant method.
Creates columns in the data table that contain canonical score formulas for each observation. The column for the kth canonical score is named Canon[<k>].
Tip: In a script, sending the scripting command Save to New Data Table to the Discriminant object saves the following to a new data table: group means on the canonical variables; the biplot rays with 1.5 Radius Scaling of the Standardized Scoring Coefficients; and the canonical scores. Not available for the Wide Linear discriminant method.
The Canonical Details report shows tests that address the relationship between the covariates and the grouping variable X. Relevant matrices are presented at the bottom of the report.
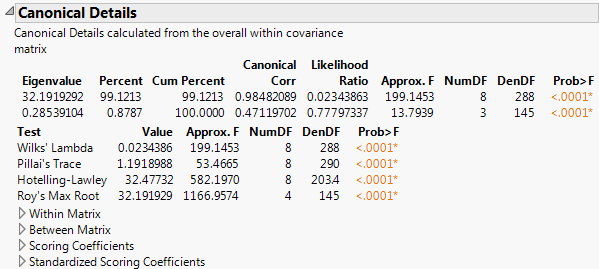
Canonical correlations between the covariates and the groups defined by the categorical X. Suppose that you define numeric indicator variables to represent the groups defined by X. Then perform a canonical correlation analysis using the covariates as one set of variables and the indicator variables representing the groups in X as the other. The Canonical Corr values are the canonical correlation values that result from this analysis.
Likelihood ratio statistic for a test of whether the population values of the corresponding canonical correlation and all smaller correlations are zero. The ratio equals the product of the values (1 - Canonical Corr2) for the given and all smaller canonical correlations.
Lists four standard tests for the null hypothesis that the means of the covariates are equal across groups: Wilk’s Lambda, Pillai’s Trace, Hotelling-Lawley, and Roy’s Max Root. See Multivariate Tests and Approximate F-Tests in Statistical Details.
F value associated with the corresponding test. For certain tests, the F value is approximate or an upper bound. See Approximate F-Tests in Statistical Details.
p-value for the corresponding test.
Coefficients used to compute canonical scores in terms of the raw data. These are the coefficients used for the option Canonical Options > Save Canonical Scores. For details about how these are computed, see “The CANDISC Procedure” in SAS Institute Inc. (2011).
Coefficients used to compute canonical scores in terms of the standardized data. Often called loadings. For details about how these are computed, see “The CANDISC Procedure” in SAS Institute Inc. (2011).
|
1.
|
These are the rows for which species is missing. You will hide and exclude these rows.
|
3.
|
Select Rows > Hide and Exclude.
|
|
4.
|
Select Rows > Color or Mark by Column.
|
|
5.
|
Select species.
|
|
6.
|
From the Colors menu, select JMP Dark.
|
|
7.
|
Check Make Window with Legend.
|
|
8.
|
Click OK.
|
|
10.
|
|
11.
|
|
12.
|
Click OK.
|
|
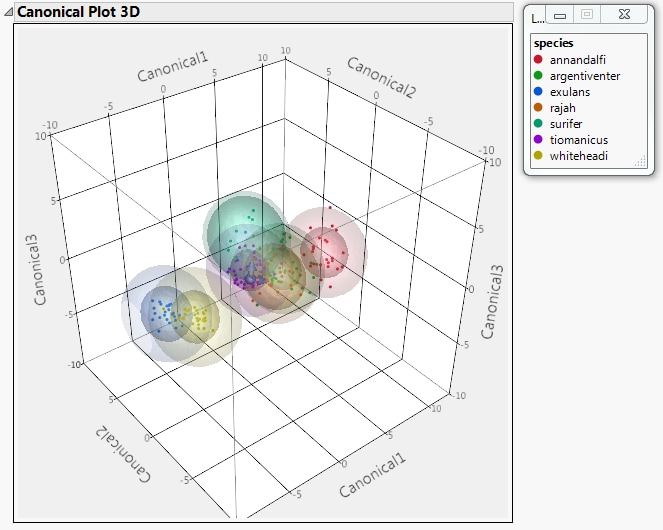
13.
|
Select Canonical 3D Plot from the Discriminant Analysis red triangle menu.
|
Observations that would be better fit using a new group are assigned to the new level, called “Other”. Probability of membership in the Other group assumes that these observations have the distribution of the entire set of observations where no group structure is assumed. This leads to correspondingly wide normal contours associated with the covariance structure. Distance calculations are adjusted by the specified prior probability.
Save Discrim Matrices creates a global list (DiscrimResults) for use in the JMP scripting language. The list contains the following, calculated for the training set:
Consider the analysis obtained using the Discriminant script in the Iris.jmp sample data table. If you select Save Discrim Matrices from the red triangle menu, the script Discrim Results is saved to the data table. The script is shown in Discrim Results Table Script for Iris.jmp.
Ellipses with 90% coverage are shown for each level of the categorical variable X. For the Linear discriminant method, these are based on the pooled within covariance matrix. Scatterplot Matrix for Iris.jmp shows the Scatterplot Matrix window for the Iris.jmp sample data table.
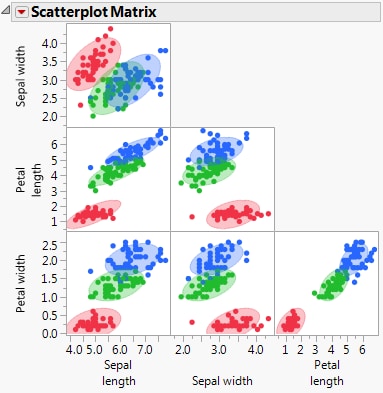
The options in the report’s red triangle menu are described in the Essential Graphing book.