Launch the Discriminant platform by selecting Analyze > Multivariate Methods > Discriminant.
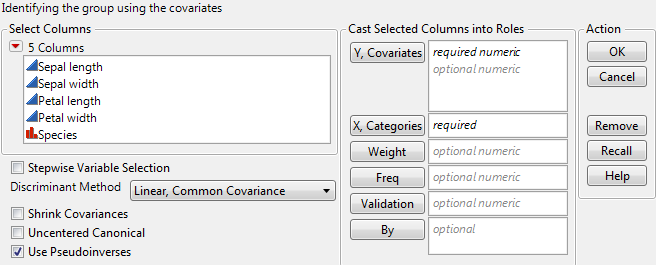
Note: The Validation button appears in JMP Pro only. In JMP, you can define a validation set using excluded rows. See Validation in JMP and JMP Pro.
|
A column whose values assign a frequency to each row for the analysis. In general terms, the effect of a frequency column is to expand the data table, so that any row with integer frequency k is expanded to k rows. Row ordering is maintained. You can specify fractional frequencies.
|
|
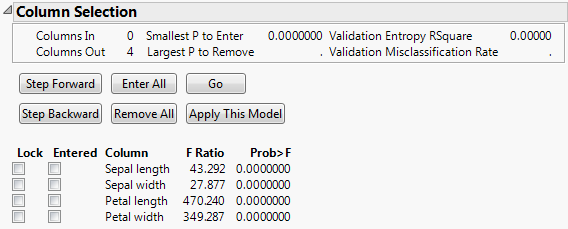
If you select the Stepwise Variable Selection option in the launch window, the Discriminant Analysis report opens, showing the Column Selection panel. Perform stepwise analysis, using the buttons to select variables or selecting them manually with the Lock and Entered check boxes. Based on your selection F ratios and p-values are updated. For details about how these are updated, see Updating the F Ratio and Prob>F.
The values for F Ratio and Prob>F given in the Stepwise report are the F ratio and p-value for the analysis of covariance test for the group variable. The analysis of covariance test for the group variable is an indicator of its discriminatory power relative to the covariate under consideration.
Entropy RSquare for the validation set. See Entropy RSquare. Larger values indicate better fit. Available only if a validation set is used.
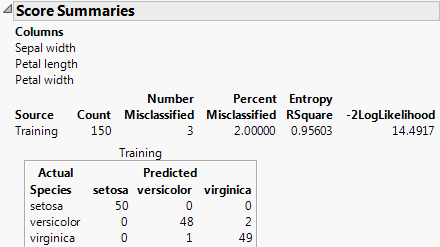
Tip: After you click Apply this Model, the columns that you select appear at the top of the Score Summaries report.
|
‒
|
If you enter a covariate and then select Lock for that covariate, it remains in the model regardless of selections made using the control buttons. The Entered box for the locked covariate shows a dimmed check mark to indicate that it is in the model.
|
|
‒
|
If you select Lock for a covariate that is not Entered, it is not entered into the model regardless of selections made using the control buttons.
|
F ratio for a test for the group variable obtained using an analysis of covariance model. For details, see Updating the F Ratio and Prob>F.
p-value for a test for the group variable obtained using an analysis of covariance model. For details, see Updating the F Ratio and Prob>F.
For an illustration of how to use Stepwise, consider the Iris.jmp sample data table.
|
1.
|
|
2.
|
Select Analyze > Multivariate Methods > Discriminant.
|
|
3.
|
|
4.
|
|
5.
|
Select Stepwise Variable Selection.
|
|
6.
|
Click OK.
|
|
7.
|
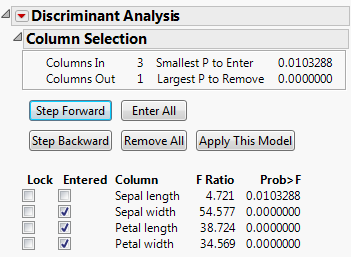
Click Step Forward three times.
|
Three covariates are entered into the model. The Smallest P to Enter appears in the top panel. It is 0.0103288, indicating that the remaining covariate, Sepal length, might also be valuable in a discriminant analysis model for Species.
|
8.
|
Click Apply This Model.
|
Note: When you enter more than 500 covariates, a JMP Alert recommends that you switch to the Wide Linear method. This is because computation time can be considerable when you use the other methods with a large number of columns. Click Wide Linear, Many Columns to switch to the Wide Linear method. Click Continue to use the method you originally selected.
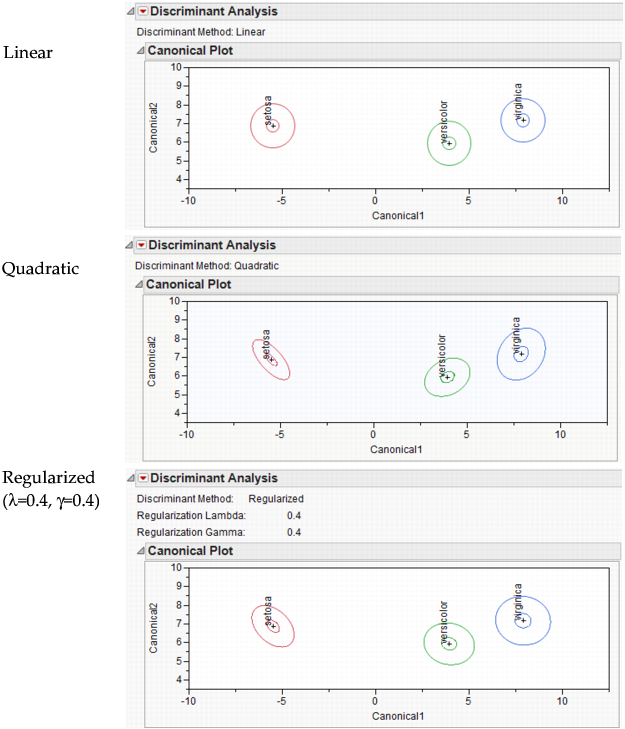
The Linear, Quadratic, and Regularized methods are illustrated in Linear, Quadratic, and Regularized Discriminant Analysis. The methods are described here briefly. For technical details, see Saved Formulas.
Performs linear discriminant analysis. This method assumes that the within-group covariance matrices are equal. SeeLinear Discriminant Method.
Performs quadratic discriminant analysis. This method assumes that the within-group covariance matrices differ. This method requires estimating more parameters than the Linear method requires. If group sample sizes are small, you risk obtaining unstable estimates. See Quadratic Discriminant Method.
Provides two ways to impose stability on estimates when the within-group covariance matrices differ. This is a useful option when group sample sizes are small. See Regularized, Compromise Method and Regularized Discriminant Method.
Useful in fitting models based on a large number of covariates, where other methods can have computational difficulties. This method assumes that all within-group covariance matrices are equal. This method uses a singular value decomposition approach to compute the inverse of the pooled within-group covariance matrix. See Description of the Wide Linear Algorithm.
|
•
|
The first parameter (Lambda, Shrinkage to Common Covariance) specifies how to mix the individual and group covariance matrices. For this parameter, 1 corresponds to Linear Discriminant Analysis and 0 corresponds to Quadratic Discriminant Analysis.
|
|
•
|
The second parameter (Gamma, Shrinkage to Diagonal) is a multiplier that specifies how much deflation to apply to the non-diagonal elements (the covariances across variables). If you choose 1, then the covariance matrix is forced to be diagonal.
|
Assigning 0 to each of these two parameters is identical to requesting quadratic discriminant analysis. Similarly, assigning 1 to Lambda and 0 to Gamma requests linear discriminant analysis. Use Regularized Discriminant Analysis to help you decide on the regularization. See Linear, Quadratic, and Regularized Discriminant Analysis for examples of linear, quadratic, and regularized discriminant analysis.