This example uses the Consumer Preferences.jmp sample data table, which contains survey data on people’s attitudes and opinions, and some questions concerning oral hygiene (source: Rob Reul, Isometric Solutions).
|
1.
|
|
2.
|
|
3.
|
|
4.
|
|
5.
|
Click OK.
|
|
6.
|
Select Crosstab Transposed from the Categorical red triangle menu.
|
|
7.
|
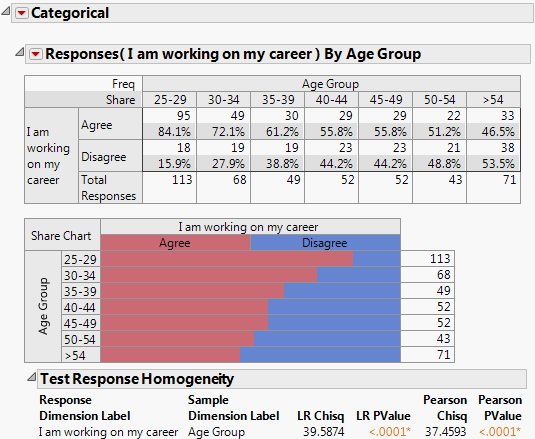
Select Test Response Homogeneity from the Categorical red triangle menu.
|
Survey Results by Age Group details the responses indicating that a respondent is currently working on his or her career and the age group. Of those responding positively, the highest majority working on their career were in the age group 25-29 at 84.1%. The highest majority of those responding oppositely were in the age group > 54 at 53.5%.
Use the response roles buttons within the tabs to choose selected columns as responses with specified roles. You can also drag column names to the response list. The response roles are summarized in Response Roles.
The default tab, Simple, contains a single button, Responses. This is appropriate for all basic analyses that do not have a special structure. You can drag column names from the Select Columns list to the Response list, or you can select columns and then click Responses. If a column has a Multiple Response column property, JMP automatically changes the handling of the column to recognize this property.
Is used for comment fields where the analysis counts the frequency of each word used. Free Text gives word counts in both word order and frequency order, and the rate of non-empty text. For more information about Free Text, refer to Free Text Report Options.
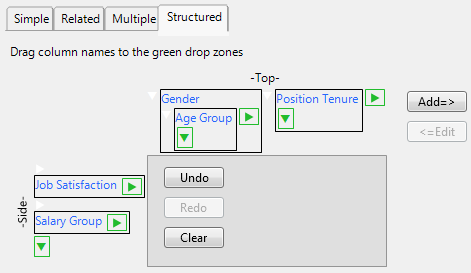
The Structured tab enables you to construct complex tables of descriptive statistics by dragging column names into green icon drop zones to create side-by-side and nested results. You can nest a variable within or beside another variable according to the structure that you want for the top and side of the table. Continue to drag columns, either beside or nested within another column, to specify the structure. For more information about structured reports, refer to Structured Report Options.
|
1.
|
Drag a column name to the green drop zone at the Top or Side of the table. The drop zone is highlighted in pink.
|
|
3.
|
When you are finished creating the table, click Add=> to add the variables to the response list.
|
|
5.
|
Should you want to make a change to the table, select Relaunch Dialog from the Categorical red triangle menu. The launch window reappears where you can make edits to your selections.
|
|
•
|
|
|
||
|
|
||
|
|
||
|
|
||
|
|
||
 |
||
|
|
||
|
|
||
|
|
||
|
|
||
Several launch options are presented in the lower left panel of the window that can be specified before the analysis. The options can also be selected later from the Categorical red triangle menu, and have the effect of rerunning the platform with the new setting. The default settings for some of the launch options can be changed in the Categorical red triangle menu. For more information, refer to Set Preferences.
Combinations gives frequency results for combinations of the X variables.
Each Individually gives frequency results for each X variable individually.
Both gives frequency results for combinations of the X variables, and individually.
The following options can be specified on the launch window as well as from the Categorical report red triangle menu. They are also available as Preference settings. For more information, refer to Statistical Options and Set Preferences.
Changes the response order but keeps the X order from low to high. The default ordering is low to high. You can control the ordering with a column property (Value Ordering), but if you always want to see the high values first, then select this option. Often, ordered categories are ratings, and you want to see the positive ratings first. In the red triangle menu, this option is under Category Options.
The term Supercategories refers to the extra slots in a table to aggregate over groups of categories. The Supercategories property supports four keywords: Group, Mean, Std Dev, and All. Mean and Std Dev calculate statistics for value scores, and All aggregates across all levels. For example, a “Top Two” Group supercategory could aggregate the two top categories in a response, as specified. Although we support Mean, Std Dev, and All, we do not recommend using them because they are available as built-in statistics as well as supercategories. Supercategories appear in Crosstab tables and Frequency Charts. Share Charts, however, do not show supercategories and ignore the Hide option described below.
Create Supercategories by selecting a column and then selecting Column Info > Column Properties > Supercatagories. On the column properties window, select a column, enter a Supercategory Name, and click Add.