This example uses the Semiconductor Capability.jmp sample data table. The variables represent standard measurements that a semiconductor manufacturer might make on a wafer as it is being processed. Specification limits for the variables have been entered in the data table through the Column Properties > Spec Limits property.
|
1.
|
|
2.
|
Select Analyze > Quality and Process > Process Capability.
|
|
3.
|
|
4.
|
|
5.
|
Click OK.
|
Example Results for Semiconductor Capability.jmp
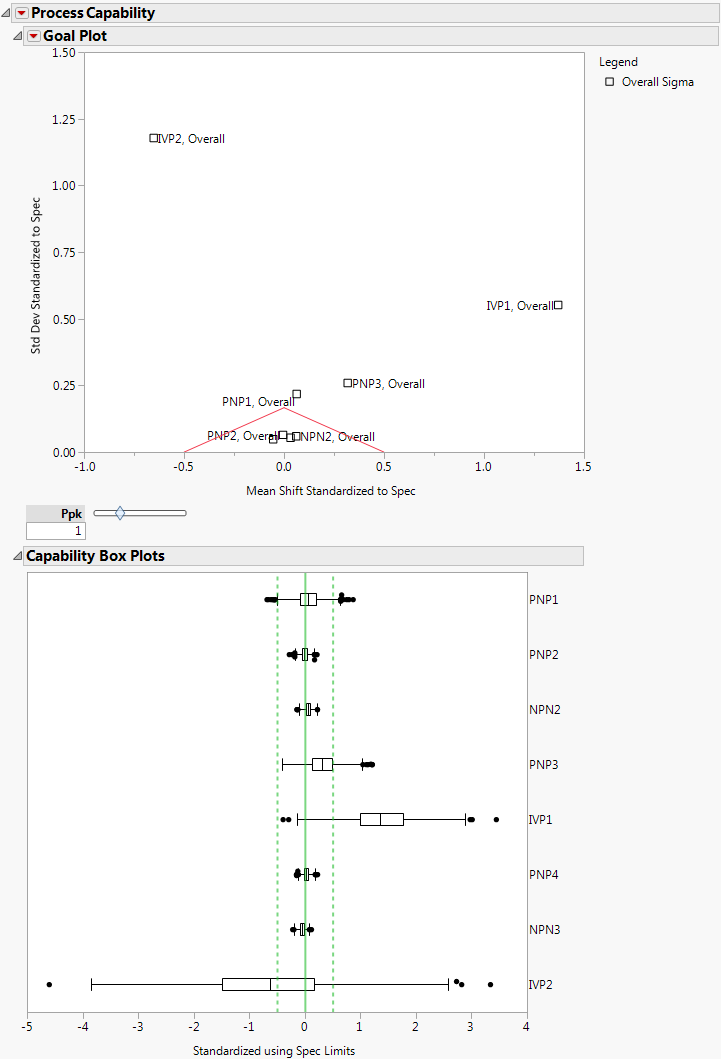
The Goal Plot in Example Results for Semiconductor Capability.jmp shows the spec-normalized mean shift on the x-axis and the spec-normalized standard deviation on the y-axis for each variable. The triangular region defined by the red lines in the bottom center of the plot is the goal triangle. It defines a region of capability index values. You can adjust the goal triangle using the Ppk slider below the plot. When the slider is set to 1, note that PNP1, PNP3, IVP1, and IVP2 are outside of the goal triangle and possibly out of specification.
The Capability Box Plots report shows a box plot for each variable in the analysis. The values for each column are centered by their target value and scaled by the specification range. It appears that the majority of points for IVP1 are above its upper specification limit (USL), and the majority of points for IVP2 are less than its target. PNP2 seems to be on target with all data points inside the specification limits.
Launch the Process Capability Platform by selecting Analyze > Quality and Process > Process Capability.

Note: The Transform menu is not available for the Select Column list in the Process Capability launch window. Right-click a column heading in the data table and select New Formula Column to create a transform column for use in Process Capability. See Using JMP for more information about creating new formula columns.
|
•
|
|
•
|
To specify a constant subgroup size, select a process from the Process List on the right, enter a subgroup size for Set Constant Subgroup Size, and click the Subgroup by Size button. The Subgroup by Size button and Set Constant Subgroup Size appear when you select Constant Subgroup Size.
|
Use the Historical Information options to specify a historical sigma value to be used in the analysis of the selected process columns. To specify a historical sigma for a process variable, select a process from the Process List on the right, enter a value for Set Historical Sigma, and click the Use Historical Sigma button.
After you click OK on the launch window, the Spec Limits window appears if any of the columns do not contain limits and you did not select No (skip columns with no spec limits) on the launch window. The Spec Limits window also appears if you select Yes on the launch window. Otherwise, the Process Capability report window appears.