Handle and MouseTrap are functions for making interactive graphs that respond to clicking and dragging. Handle lets you parametrize a graph by adding a handle-marker that can be dragged around with the mouse, executing the graph’s script at each new location. MouseTrap is similar, but it takes its arguments from the coordinates of a click, without dragging a handle. The main difference is that Handle only catches mousedowns at the handle-marker’s location, but MouseTrap catches mousedowns at any location.
Another approach is to place buttons or slider controls outside the graph with Button Box, Slider Box, or Global Box.
Handle places a marker at the coordinates given by the initial values of the first two arguments and draws the graph using the initial values of the arguments. You can then click and drag the marker to move the handle to a new location. The first script is executed at each mousedown to update the graph dynamically, according to the new coordinates of the handle. The second script (optional, and not used here) is executed at each mouseup, similarly; see the example for MouseTrap.
Normal Density Example for Handle
If you want to use some function of a handle’s coordinates, such as in the normal density example, you should adjust the arguments for Handle. Otherwise, the handle marker would run away from the mouse. For example:
Suppose you drag the marker from its initial location to (3,4). The argument a is set to 6 and b to 4, the graph is redrawn as Y = 6x4, and the handle is now drawn at (6,4), several units away from the mouse. To compensate, you would adjust the first argument to handle, for example.
To generalize, suppose you define the Handle arguments as functions of the handle’s (x, y) coordinates. For example, a=f(x);b=g(y). If f(x)=x and g(y)=y, then you would specify simply a,b as the first two arguments. If not, you would solve a = f(x) for x and solve b = g(y) for y to get the appropriate arguments.
You can use other functions to constrain Handle. For example, here is an interactive graph to demonstrate power functions that uses Round() to prevent bad exponents and to keep the intercepts simple.
Handle and For can be nested for complex graphs.
MouseTrap takes arguments for a graph from the coordinates of a mouse click. The first script is executed after each mousedown and the second script after each mouseup to update the graph dynamically, according to the new coordinates of the handle. As with Handle, it is important to set the initial values for the MouseTrap’s coordinates. If you include both MouseTraps and Handles in a graph, put the Handles before the MouseTraps so they have a chance to catch clicks before a MouseTrap does.
This example uses both MouseTrap and Handle to draw a three-dimensional function centered on the MouseTrap coordinates, where the single contour line takes its value from a Handle.
You might use MouseTrap to collect points in a data table, such as for visually interpolating points in a graph. Here is an example illustrating a script that could be adapted and added to a data plot (such as a scatterplot from Fit Y by X) for that purpose:
There are five Drag functions to perform similar functions to Handle and MouseTrap but with more than one point at a time. For n coordinates in matrices listed as the first two arguments:
|
•
|
Drag Marker draws n markers.
|
|
•
|
|
•
|
Drag Rect draw a filled rectangle using the first two coordinates, ignoring any further coordinates.
|
|
•
|
Drag Polygon draws a filled polygon with n vertices.
|
|
•
|
Drag Text draws a text item at the coordinates, or if there is a list of text items, draws the ith list item at the ith (x,y) coordinate. If there are fewer list items than coordinate pairs, the last item is repeated for remaining points.
|
They all must have L-value arguments for the coordinates, in other words, literal matrices or names of matrix values that are modified if you click a vertex and drag it to a new position. The script arguments are optional, and behave the same as with Handle. However, there is no x nor y that is modified as in Handle.
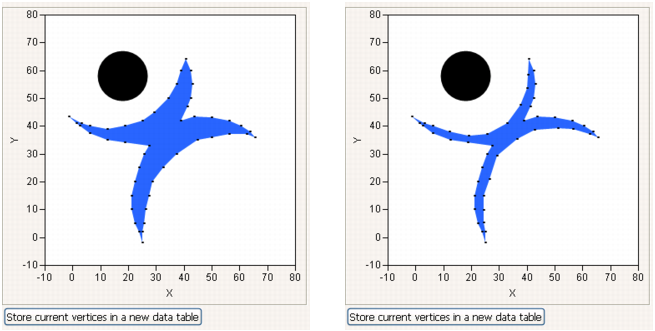
The Drag operators are ways to display data that the user can adjust and then capture the adjusted values. Consider the earlier script to draw the JMP man. Drag Polygon makes it possible to draw an editable JMP man; using a matching Drag Marker statement makes the vertices more visible. And, similar to the Mouse Trap example, you can save the new coordinates to a data table. Notice how : and :: operators avoid ambiguity among matrices and data table columns with the same names.
You could just as easily put storepoints in the fourth argument of Drag Polygon or Drag Marker, but that would create a data table after each drag, and you probably just want a single data table when you are finished. Regardless, the values in gCoordX and gCoordY update with each drag.
Perhaps you think the JMP Man needs to lose some weight. Here is how he looks before and after some judicious vertex-dragging. Clicking the button after re-shaping the JMP Man executes the storepoints script to save his new, slender figure in a data table of coordinates.
|
•
|
Button Box, which creates controls outside the graph,
|
|
•
|
V List Box, which glued the graph box and the button box together in the same graph window.
|
If your interactive graphs do not work as expected, make sure that you supply initial values for the Handle or MouseTrap coordinates (and other globals as needed), and that the values make sense for the graph.