The k-means approach to clustering performs an iterative alternating fitting process to form the number of specified clusters. The k-means method first selects a set of n points called cluster seeds as a first guess of the means of the clusters. Each observation is assigned to the nearest seed to form a set of temporary clusters. The seeds are then replaced by the cluster means, the points are reassigned, and the process continues until no further changes occur in the clusters. When the clustering process is finished, you see tables showing brief summaries of the clusters. The k-means approach is a special case of a general approach called the EM algorithm; E stands for Expectation (the cluster means in this case), and M stands for maximization, which means assigning points to closest clusters in this case.
The k-means method is intended for use with larger data tables, from approximately 200 to 100,000 observations. With smaller data tables, the results can be highly sensitive to the order of the observations in the data table.
K-Means clustering only supports numeric columns. K-Means clustering ignores model types (nominal and ordinal), and treat all numeric columns as continuous columns.
To see the KMeans cluster launch dialog (see KMeans Launch Dialog), select KMeans from the Options menu on the platform launch dialog. The figure uses the Cytometry.jmp data table.
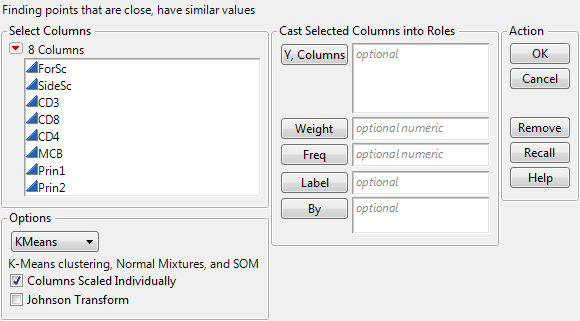
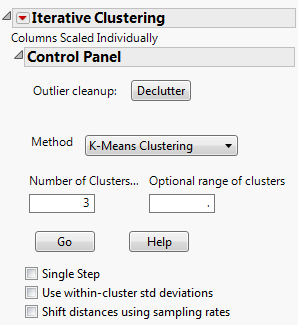
As an example of KMeans clustering, use the Cytometry.jmp sample data table. Add the variables CD3 and CD8 as Y, Columns variables. Select the KMeans option. Click OK. The Control Panel appears, and is shown in Iterative Clustering Control Panel.
The Iterative Clustering red-triangle menu has the Save Transformed option. This saves the Johnson transformed variables to the data table. This option is available only if the Johnson Transform option is selected on the launch dialog (KMeans Launch Dialog).
|
Locates outliers in the multivariate sense. Plots are produced giving distances between each point and that points nearest neighbor, the second nearest neighbor, up to the kth nearest neighbor. You are prompted to enter k. Beneath the plots are options to create a scatterplot matrix, save the distances to the data table, or to not include rows that you have excluded in the clustering procedure. If an outlier is identified, you might want to exclude the row from the clustering process.
|
|||||||||
|
|||||||||
|
Enables you to step through the clustering process one iteration at a time using a Step button, or automate the process using a Go button.
|
|||||||||
Clicking Go in the Control Panel in Iterative Clustering Control Panel produces the K-Means report, shown in K-Means Report.
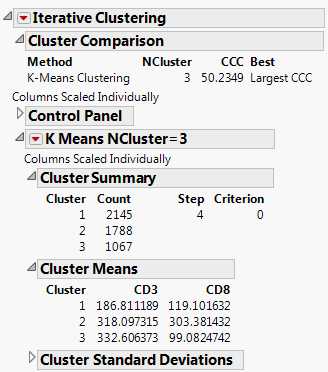
The Cluster Comparison report gives fit statistics to compare different numbers of clusters. For KMeans Clustering and Self Organizing Maps, the fit statistic is CCC (Cubic Clustering Criterion). For Normal Mixtures, the fit statistic is BIC or AICc. Robust Normal Mixtures does not provide a fit statistic.
|
|||||||
|
Creates a parallel coordinate plot for each cluster. For details about the plots, see the Basic Analysis book. The plot report has options for showing and hiding the data and means.
|
|||||||