When you launch the Control Chart platform by selecting Analyze > Quality And Process > Control Chart, you will see a Control Chart Launch window similar to XBar Control Chart Launch Window. The exact controls vary depending on which type of chart you select. Initially, the window shows the following types of information:
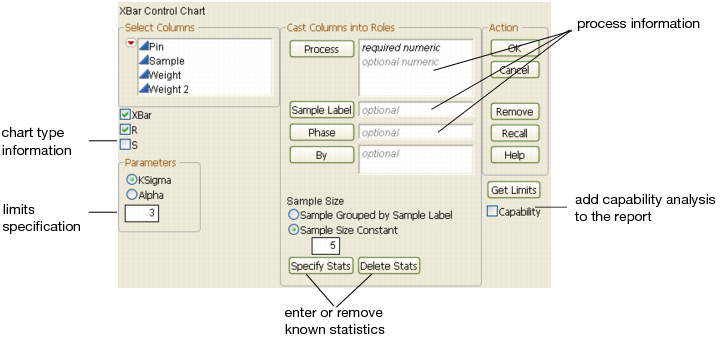
The Process role selects variables for charting.
Note: The rows of the table must be sorted in the order in which you want them to appear in the control chart. Even if there is a Sample Label variable specified, you still must sort the data accordingly.
The Sample Label role enables you to specify a variable whose values label the horizontal axis and can also identify unequal subgroup sizes. If no sample label variable is specified, the samples are identified by their subgroup sample number.
|
•
|
If the sample subgroups are the same size, select the Sample Size Constant option and enter the size in the text box. If you entered a Sample Label variable, its values are used to label the horizontal axis. The sample size is used in the calculation of the limits regardless of whether the samples have missing values.
|
|
•
|
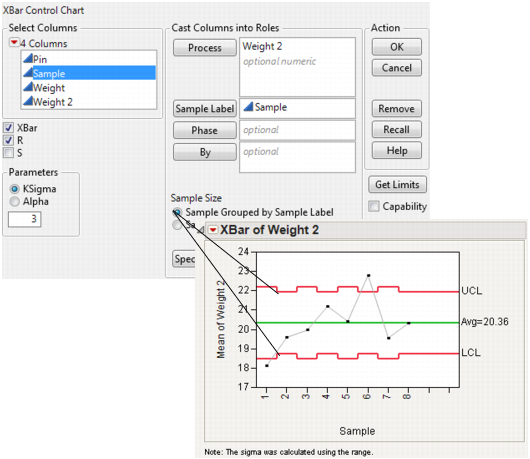
If the sample subgroups have an unequal number of rows or have missing values and you have a column identifying each sample, select the Sample Grouped by Sample Label option and enter the sample identifying column as the sample label.
|
For attribute charts (p-, np-, c-, and u-charts), this variable is the subgroup sample size. Additional options appear on the launch window, including Sample Size, Constant Size, and/or Unit Size, depending on your selection. In variables charts, it identifies the sample. When the chart type is IR, a Range Span text box appears. The range span specifies the number of consecutive measurements from which the moving ranges are computed.
Note: The rows of the table must be sorted in the order in which you want them to appear in the control chart. Even if there is a Sample Label variable specified, you still must sort the data accordingly.
The illustration in Variables Charts with Unequal Subgroup Sample Sizes shows an X-chart for a process with unequal subgroup sample sizes, using the Coating.jmp sample data from the Quality Control sample data folder.
The Phase role enables you to specify a column identifying different phases, or sections. A phase is a group of consecutive observations in the data table. For example, phases might correspond to time periods during which a new process is brought into production and then put through successive changes. Phases generate, for each level of the specified Phase variable, a new sigma, set of limits, zones, and resulting tests.
On the window for X-, R-, S-, IR-, P-, NP-, C-, U-, Presummarize, and Levey-Jennings charts, a Phase variable button appears. If a phase variable is specified, the phase variable is examined, row by row, to identify to which phase each row belongs. Saving to a limits file reveals the sigma and specific limits calculated for each phase. See Phase Example for an example.
The By role identifies a variable to produce a separate analysis for each value that appears in the column.
|
•
|
|
•
|
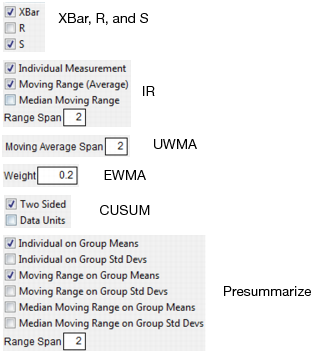
The IR menu selection has check box options for the Individual Measurement, Moving Range, and Median Moving Range charts.
|
|
•
|
The uniformly weighted moving average (UWMA) and exponentially weighted moving average (EWMA) selections are special charts for means.
|
|
•
|
The CUSUM chart is a special chart for means or individual measurements.
|
|
•
|
Presummarize enables you to specify information about pre-summarized statistics.
|
|
•
|
You can specify computations for control limits by entering a value for k (K Sigma), or by entering a probability for α(Alpha), or by retrieving a limits value from the process columns' properties or a previously created Limits Table. Limits Tables and the Get Limits button are discussed in the section Saving and Retrieving Limits. There must be a specification of either K Sigma or Alpha. The window default for K Sigma is 3.
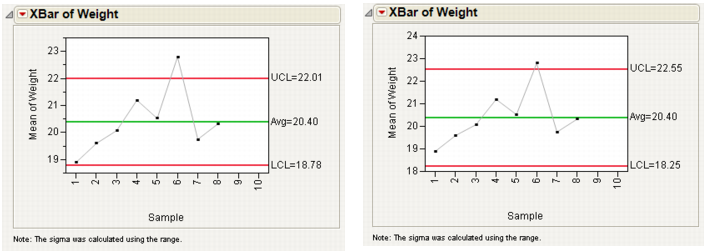
The KSigma parameter option allows specification of control limits in terms of a multiple of the sample standard error. KSigma specifies control limits at k sample standard errors above and below the expected value, which shows as the center line. To specify k, the number of sigmas, click the radio button for KSigma and enter a positive k value into the text box. The usual choice for k is 3, which is three standard deviations. The examples shown in K Sigma =3 (left) and K Sigma=4 (right) Control Limits compare the X-chart for the Coating.jmp data with control lines drawn with KSigma = 3 and KSigma = 4.
The Alpha parameter option specifies control limits (also called probability limits) in terms of the probability α that a single subgroup statistic exceeds its control limits, assuming that the process is in control. To specify alpha, click the Alpha radio button and enter the probability that you want. Reasonable choices for α are 0.01 or 0.001. The Alpha value equivalent to a KSigma of 3 is 0.0027.
After specifying a process variable, if you click the Specify Stats (when available) button on the Control Chart Launch window, a tab with editable fields is appended to the bottom of the window. This lets you enter historical statistics (that is, statistics obtained from historical data) for the process variable. The Control Chart platform uses those entries to construct control charts. The example here shows 1 as the standard deviation of the process variable and 20 as the mean measurement.
If you check the Capability option on the Control Chart launch window (see XBar Control Chart Launch Window), a window appears as the platform is launched asking for specification limits. The standard deviation for the control chart selected is sent to the window and appears as a Specified Sigma value, which is the default option. After entering the specification limits and clicking OK, capability output appears in the same window next to the control chart. For information about how the capability indices are computed, see the Basic Analysis book.