Plots the VIP values for each X variable. VIP scores appear in the Variable Importance Table. See Variable Importance Plot.
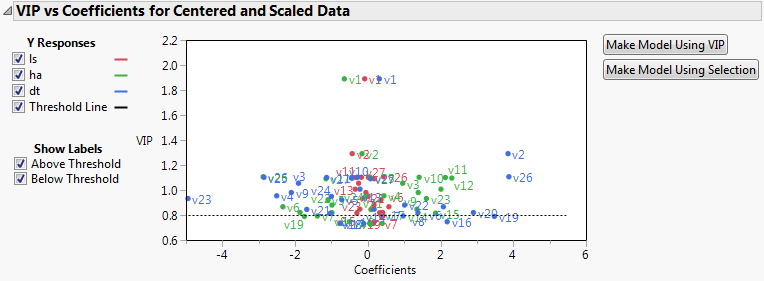
Plots the VIP statistics against the model coefficients. You can show only those points corresponding to your selected Ys. Additional labeling options are provided. There are plots for both the centered and scaled data and the original data. See VIP vs Coefficients Plots.
Plots the model coefficients for each response across the X variables. You can show only those points corresponding to your selected Ys. There are plots for both the centered and scaled data and the original data.
Fit Line Shows or hides a fitted line through the points on the X-Y Scores Plots.
Show Confidence Band Shows or hides 95% confidence bands for the fitted lines on the X-Y Scores Plots. These should be used only for outlier detection.
Shows a scatterplot matrix of the X scores and a scatterplot matrix of the Y scores. Each X score scatterplot displays a 95% confidence ellipse, which can be used for outlier detection. For statistical details about the confidence ellipses, see Confidence Ellipses for X Score Scatterplot Matrix.
Shows a plot of T2 statistics for each observation, along with a control limit. An observation’s T2 statistic is calculated based on that observation’s scores on the extracted factors. For details about the computation of T2 and the control limit, see T2 Plot.
Opens and populates a launch window with the appropriate responses entered as Ys and the variables whose VIPs exceed the specified threshold entered as Xs. Performs the same function as the button in the VIP vs Coefficients for Centered and Scaled Data report. See VIP vs Coefficients Plots.
|
•
|
Make Model Using VIP opens and populates a launch window with the appropriate responses entered as Ys and the variables whose VIPs exceed the specified threshold entered as Xs.
|
|
•
|
Make Model Using Selection enables you to select Xs directly in the plot and then enters the Ys and only the selected Xs into a launch window.
|
For each response, saves a column to the data table called Pred Formula <response> that contains its the prediction formula.
For each response, saves a column to the data table called Pred Formula <response> that contains the prediction formula in terms of the X scores.
For each response, saves a column to the data table called PredSE <response> that contains the standard error of the predicted mean. For details, see Standard Error of Prediction and Confidence Limits.
For each response, saves two columns to the data table called Lower 95% Mean <response> and Upper 95% Mean <response>. These columns contain 95% confidence limits for the response mean. For details, see Standard Error of Prediction and Confidence Limits.
For each response, saves two columns to the data table called Lower 95% Indiv <response> and Upper 95% Indiv <response>. These columns contain 95% prediction limits for individual values. For details, see Standard Error of Prediction and Confidence Limits.
Saves a column to the data table called X Score <N> Formula containing the formula for each X Score. See Partial Least Squares.
Saves the X and Y standardized scores used in constructing the Correlation Loading Plot to the data table. For the formulas, see Standardized Scores and Loadings.
Saves the X and Y standardized loadings used in constructing the Correlation Loading Plot to new data tables. For the formulas, see Standardized Scores and Loadings.
Saves the T2 values to the data table. These are the values used in the T Square Plot.
Saves the Distance to X Model (DModX) and Distance to Y Model (DModY) values to the data table. These are the values used in the Distance Plots.