|
•
|
|
•
|
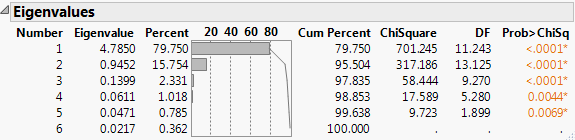
If you select the Bartlett Test option from the red triangle menu, hypothesis tests (Bartlett Test) are given for each eigenvalue (Jackson, 2003).
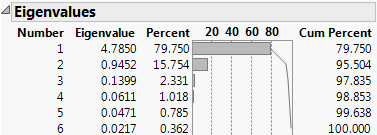
Shows the results of the homogeneity test (appended to the Eigenvalues table) to determine if the eigenvalues have the same variance by calculating the Chi-square, degrees of freedom (DF), and the p-value (prob > ChiSq) for the test. See Bartlett (1937, 1954).
|
‒
|
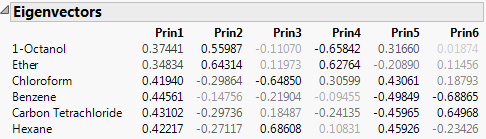
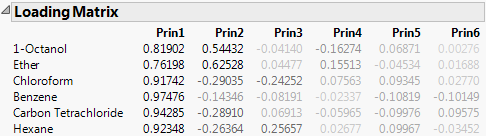
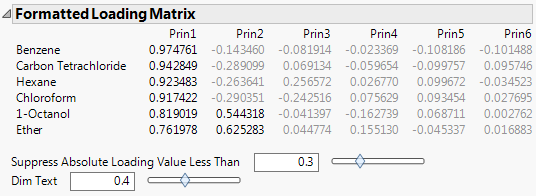
For the on Correlations option, the ith column of loadings is the ith eigenvector multiplied by the square root of the ith eigenvalue. The i,jth loading is the correlation between the ith variable and the jth principal component.
|
|
‒
|
For the on Covariances option, the jth entry in the ith column of loadings is the ith eigenvector multiplied by the square root of the ith eigenvalue and divided by the standard deviation of the jth variable. The i,jth loading is the correlation between the ith variable and the jth principal component.
|
|
‒
|
For the on Unscaled option, the jth entry in the ith column of loadings is the ith eigenvector multiplied by the square root of the ith eigenvalue and divided by the standard error of the jth variable. The standard error of the jth variable is the jth diagonal entry of the sum of squares and cross products matrix divided by the number of rows (X’X/n).
|
Note: When you are analyzing the unscaled data, the i,jth loading is not the correlation between the ith variable and the jth principal component.
Shows or hides the summary information produced in the initial report. See Principal Components Report.
Shows a matrix of scatterplots of the scores for pairs of principal components for the specified number of components. This plot is shown in Principal Components on Correlations Report (left-most plot).
Shows a matrix of two-dimensional representations of factor loadings for the specified number of components. The loading plot labels variables if the number of variables is 30 or fewer. If there are more than 30 variables, the labels are off by default. This information is shown in Principal Components on Correlations Report (right-most plot).
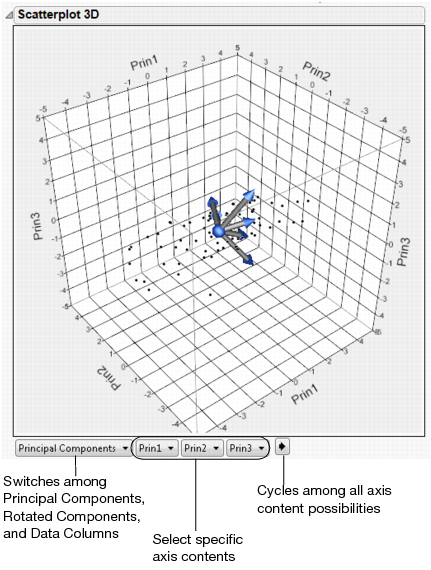
The variables show as rays in the plot. These rays, called biplot rays, approximate the variables as a function of the principal components on the axes. If there are only two or three variables, the rays represent the variables exactly. The length of the ray corresponds to the eigenvalue or variance of the principal component.
Performs factor analysis-style rotations of the principal components, or factor analysis. See the Factor Analysis chapter in the Consumer Research book for details.
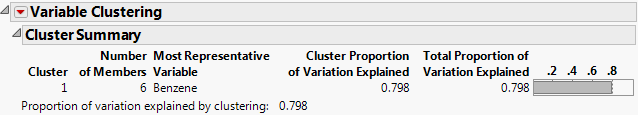
Performs a cluster analysis on the variables by dividing the variables into non-overlapping clusters. Variable clustering provides a method for grouping similar variables into representative groups. Each cluster can then be represented by a single component or variable. The component is a linear combination of all variables in the cluster. Alternatively, the cluster can be represented by the variable identified to be the most representative member in the cluster. See Cluster Variables.
|
‒
|
For the on Correlations option, the ith principal component is a linear combination of the centered and scaled observations using the entries of the ith eigenvector as coefficients.
|
|
‒
|
For the on Covariances options, the ith principal component is a linear combination of the centered observations using the entries of the ith eigenvector as coefficients.
|
|
‒
|
For the on Unscaled option, the ith principal component is a linear combination of the raw observations using the entries of the ith eigenvector as coefficients.
|
Contains options that are available to all platforms. See the Using JMP book.
The ith principal component is a linear combination of the centered and scaled observations using the entries of the ith eigenvector as coefficients.
In the data table, the principal components are given in columns called Prin<number>. The formulas depend on an additional saved column called Prin Data Matrix. This column contains the difference between the vector of the raw data, given by a Matrix expression, and the vector of means.
Contains options that are available to all platforms. See the Using JMP book.
Principal components analysis constructs components that are linear combinations of all the variables in the analysis. In contrast, the Cluster Variables option constructs components that are linear combinations of variables in a cluster of similar variables. The entire set of variables is partitioned into clusters. For each cluster, a cluster component is constructed using the first principal component of the variables in that cluster. This is the linear combination that explains as much of the variation as possible among the variables in that cluster.
|
b.
|
Note: An orthoblique rotation is also know as a raw quartimax rotation. See Harris and Kaiser (1964).
Saves columns called Cluster <i> Components to the data table. Each column is given by a formula that expresses the cluster component in terms of the uncentered and unscaled variables.