To restructure a column or multiple columns, select Cols > Utilities and choose from the list of options. At least one column must be selected to enable these menu options.
Use the Text to Columns option to make a character column with delimited fields into multiple columns. Highlight a column from a data table and select Cols > Utilities > Text to Columns. The maximum number of delimited fields across all rows determines the number of new columns created.
Note: Text to Columns is case-sensitive.
The Text to Columns window has the following options:
Allows any empty rows to be counted as a category. An additional column named Missing is added to the data table. A value of 1 indicates an empty row.
Make a categorical column into multiple columns based on each distinct category. Highlight a column in a data table and select Cols > Utilities > Make Indicator Columns. Multiple columns with values of either 0 or 1 are created. A value of 1 indicates that the original column contains that specific category.
The Combine Columns option is the opposite of Text to Columns. Instead of making multiple columns, you can combine a set of columns into one character column with delimited fields.
|
1.
|
|
2.
|
|
3.
|
Select Cols > Utilities > Combine Columns.
|
|
5.
|

The selected columns are represented in the Combined Floss column with each field separated by a comma. Only the columns that have a value of 1 are represented in the combined column for each given row.
|
•
|
A numeric column with non-integer values can also be compressed if there are fewer than 255 unique values. In this case, the List Check property is added to the column.
Caution: In a column with the List Check property, you can enter only a value that is in the list. Otherwise, JMP warns that the cell contains invalid data when you try to enter the new value. For details, see List Check.


To compress columns, select one or more columns and select Cols > Utilities > Compress Selected Columns. (Select all columns if you do not know which columns can be compressed.)
The column or columns are compressed if possible. The log shows which columns were compressed and how they were compressed. (Select View > Log to show the log.)
Note: To compress a numeric column manually, set your Tables preferences to allow short numeric data and then change the column’s data type to 1-byte integer, 2-byte integer, or 4-byte integer. For details about this preference, see Tables in JMP Preferences.
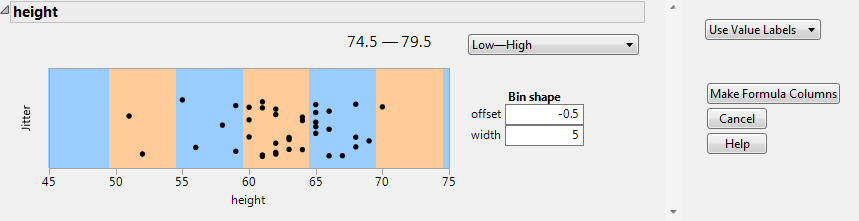
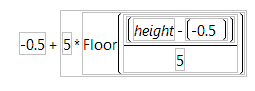
You can distribute your data into equal width bins using the Make Binning Formula option. Select the column or columns that you want to divide into bins, and select Cols > Utilities > Make Binning Formula. New formula columns are added to the data table.
|
‒
|
Select Use Value Labels to show a label instead of the value.
|
|
‒
|
Select Use Range Values to include the lower and upper values for each range in the label.
|
|
‒
|
Select No Labels to use the lower edge value as the label.
|
|
1.
|
|
2.
|
Select the height column.
|
|
3.
|
Select Cols > Utilities > Make Binning Formula.
|
|
4.
|
Change the offset to -0.5.
|
|
5.
|
Keep the width set to 5.
|
|
6.
|
For the labels, keep it set to Use Value Labels, so that you can see the range of values for the bin.
|
|
7.
|
Click Make Formula Columns.
|
|
8.
|
To perform further analyses on your data, use the New Formula Column menu options from your existing data table. Formula columns use formulas or calculations to define column values.
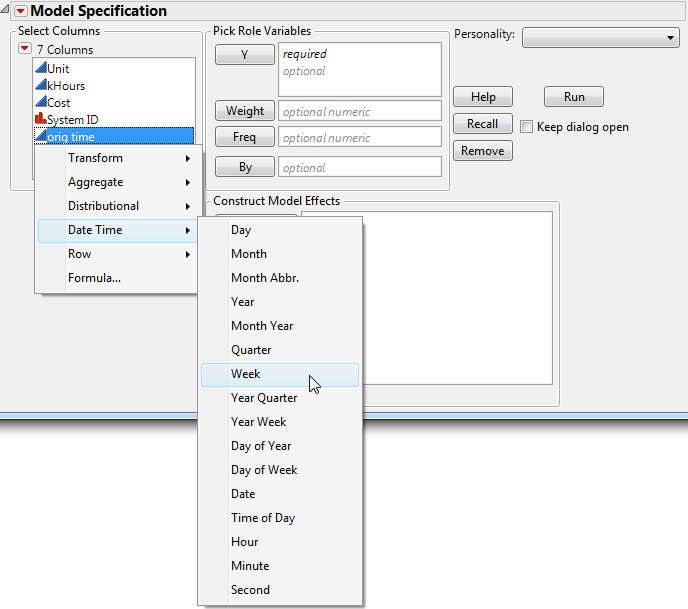
Right‐click a column heading in your data table and select New Formula Column. Choose from either Transform, Combine, Aggregate, Distributional, Date, Row, or Formula to calculate column values. A new formula column is added to the data table. See Virtual Columns for a description of these options.
Note: The same options exist in both the New Formula Column menu, and the right-click column menu in the launch window. However, performing these tasks in a launch window results in a temporary column, and New Formula Column adds a new column to the original data table.
Right-click options depend on the selected column’s data type and the number of columns selected. If the selected column is a Character column, Character and Row options appear. See Character Menu and Row Menu for more information.
Each column listed in the Select Columns pane of the launch window includes an icon representing the column’s modeling type (continuous, ordinal, or nominal) and the column name. Right-click on a column name to create a virtual column using either Transform, Combine, Aggregate, Distributional, Date, Row, or Formula to calculate the column’s values.
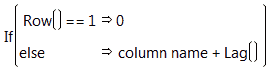
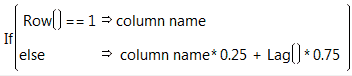
For a Numeric column, creates a virtual column based on the transcendental calculation that you select. See Transform Menu.
For selected Numeric columns, creates a virtual column based on the calculation that you select. See Combine Menu.
For a Numeric column, creates a virtual column based on the aggregate function that you select. See Aggregate Menu.
For a Numeric column, creates a virtual column based on the distributional function that you select. See Distributional Menu.
For a column that contains date or time values, creates a virtual column based on the date/time function that you select. See Date Time Menu.
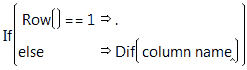
For all data types, creates a virtual column based on the row function that you select. See Row Menu.
For all data types, creates a virtual column containing the custom transform data based on the formula that you select. See Create a Formula in Formula Editor for details.
Note: The virtual column is available only in the current launch window. To make the virtual column available outside of the current launch window, right-click the virtual column and select Add to Data Table. The virtual column is added to the source data table.
Select a function from the Transform menu to create a virtual column containing the calculations based on the selected function. For details about listed functions, see the JSL Syntax Reference. Also refer to Fitting Linear Models for additional information.
Select multiple columns to access the Combine menu. The Combine menu creates a virtual column containing the calculations based on the selected function. For details about listed functions, see the JSL Syntax Reference.
Select a function from the Aggregate menu to create a virtual column containing the statistics calculated from the selected column (or part of a column if you specified a Group By column). For details about listed functions, see the JSL Syntax Reference.
Select a function from the Distributional menu to create a virtual column containing the statistics calculated from the selected column.
Transforms the data using the Box-Cox equation. For more details, see Fitting Linear Models.
Creates two columns. The Informative column replaces missing values with the column mean. The Is Missing column indicates 1 for missing values, and 0 otherwise.
For column values containing date or time values, select a function from the Date Time menu to create a virtual column containing values calculated from the selected column. For details about listed functions, see the JSL Syntax Reference.
Select a function from the Character menu to create a virtual column containing strings formed by the selected Character function. For details about listed functions, see the JSL Syntax Reference.
Select a function from the Row menu to create a virtual column containing calculations determined by the selected Row function. For details about listed functions, see the JSL Syntax Reference.
|
•
|
If you need to recode similar values within multiple columns, use the Recode option in Cols > Standardize Attributes. See Standardize Attributes in The Column Info Window.
|
|
1.
|
|
2.
|
Select the Type column by clicking once on the column heading.
|
|
3.
|
Select Cols > Utilities > Recode.
|
|
4.
|
In the Recode window, enter the desired values in the New Value boxes. For this example, enter Technical in the Computer row, and Drug in the Pharmaceutical row.
|
|
5.
|

Note: If you enter a non-numeric value in a column with a Numeric data type, you are prompted to convert the data type to Character. Click Yes to convert the column and display the new value. Click No to keep the column Numeric and display a missing value.
When you are finished recoding data, click Done to view the following options:
becomes active when multiple values are selected. Click Group to make highlighted values part of the same group. If you previously edited a value before grouping, the edited value becomes the group representative in the New Value column. Otherwise, the group representative is the value that occurs most often.
removes leading and trailing whitespace characters and removes duplicate interior whitespace characters. That is, if more than one whitespace character is present, the Collapse Whitespace command replaces the two spaces with one space.
right-click selected values to select a different grouping value, or group representative. The Group To command displays the Old Values that occur most often in the data table with their corresponding New Values (if they are different). The list displays the first 8 possible group representatives.
when two values are highlighted, select Swap New Values to make the new value of the first value adopt the new value of the second value, and vice versa.
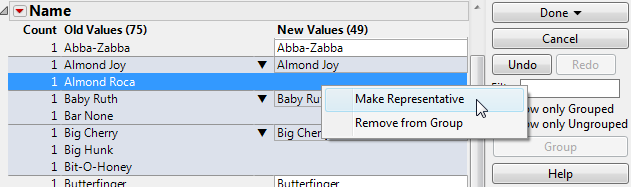
right-click a single value from a group and select Make Representative to make the selected value the New Value.
Select the following Group Similar Values commands to increase the accuracy of grouping:
|
1.
|
|
2.
|
Select the Name column.
|
|
3.
|
Select Cols > Utilities > Recode.
|
|
4.
|
From the red triangle menu, select Group Similar Values.
|
|
5.
|
Select the Max Character Difference option and type “6”.
|
|
6.
|
Click OK.
|
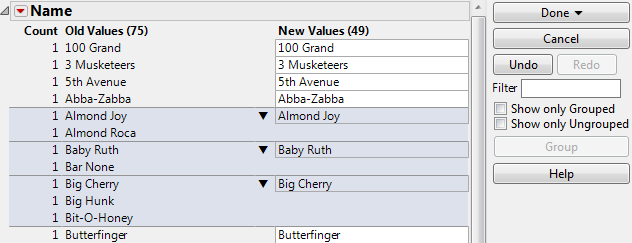
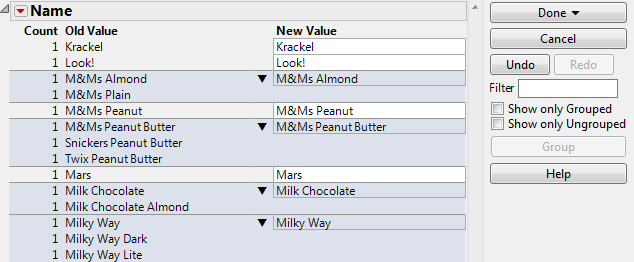
In this example, the grouped values have no more than 6 characters different between them. The values shown in the New Value column represents the grouped values in the recoded data table.
|
7.
|
Right-click Almond Roca and select Make Representative to change the new value to represent a different value within the group.
|
To remove values from a group, right-click and select Remove from Group.
|
8.
|
|
1.
|
|
2.
|
Select the Name column.
|
|
3.
|
Select Cols > Utilities > Recode.
|
|
4.
|
From the red triangle menu, select Group Similar Values.
|
|
5.
|
Select the Difference Ratio option and type “.5”.
|
|
6.
|
Click OK.
|
|
7.
|
From the red triangle menu, select Done > New Column to save the recoded data in a new column in the data table.
|