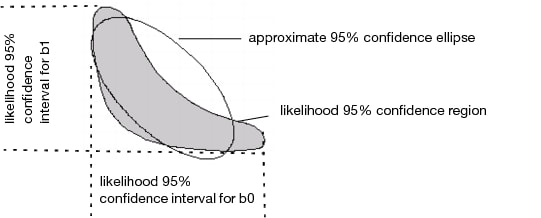
The upper and lower confidence limits for the parameters are based on a search for the value of each parameter after minimizing with respect to the other parameters. The search looks for values that produce an SSE greater by a certain amount than the solution’s minimum SSE. The goal of this difference is based on the F-distribution. The intervals are sometimes called likelihood confidence intervals or profile likelihood confidence intervals (Bates and Watts 1988; Ratkowsky 1990).
Profile confidence limits all start with a goal SSE. This is a sum of squared errors (or sum of loss function) that an F test considers significantly different from the solution SSE at the given alpha level. If the loss function is specified to be a negative log-likelihood, then a Chi-square quantile is used instead of an F quantile. For each parameter’s upper confidence limit, the parameter value is increased until the SSE reaches the goal SSE. As the parameter value is moved up, all the other parameters are adjusted to be least squares estimates subject to the change in the profiled parameter. Conceptually, this is a compounded set of nested iterations. Internally there is a way to do this with one set of iterations developed by Johnston and DeLong. See SAS/STAT 9.1 vol. 3 pp. 1666-1667.
Diagram of Confidence Limits for Parameters shows the contour of the goal SSE or negative likelihood, with the least squares (or least loss) solution inside the shaded region:
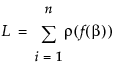
Suppose that f(β) is the model. Then the Nonlinear platform attempts to minimize the sum of the loss functions written as
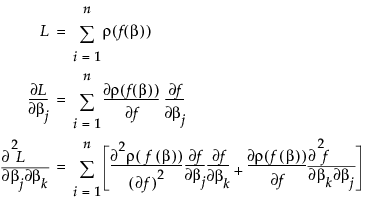
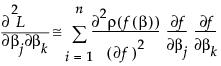
The second term is probably small if ρ is the squared residual because the sum of residuals is small. The term is zero if there is an intercept term. For least squares, this is the term that distinguishes Gauss-Newton from Newton-Raphson. In JMP, the second term is calculated only if the Second Derivative option is checked.
If you open the Negative Exponential.jmp nonlinear sample data example, the actual formula for the Nonlinear column looks something like this:
The Parameter block in the formula is hidden if you use the formula editor. That is how it is stored in the column and how it appears in the Nonlinear Launch dialog. Two parameters named b0 and b1 are given initial values and used in the formula to be fit.
The Nonlinear platform makes a separate copy of the formula, and edits it to extract the parameters from the expression. Then it maps the references to them to the place where they are estimated. Nonlinear takes the analytic derivatives of the prediction formula with respect to the parameters. If you use the Show Derivatives command, you get the resulting formulas listed in the log, like this:
The Derivative of Model with respect to the parameters is:
|
•
|
When the prediction model needs additional subexpressions evaluated, it uses the First function, which returns the value of the first argument expression, and also evaluates the other arguments. In this case additional assignments are needed for derivatives.
|
|
•
|
The derivative table itself is a list of expressions, one expression for each parameter to be fit. For example, the derivative of the model with respect to b0 is T#1; its thread in the prediction model is 1–(Exp(-b1*X)). The derivative with respect to b1 is T#3*b0, which is –(–1*Exp(-b1*X)*X)*b0 if you substitute in the assignments above. Although many optimizations are made, it does not always combine the operations optimally. You can see this by the expression for T#3, which does not remove a double negation.
|
If you ask for second derivatives, then you get a list of (m(m + 1))/2 second derivative expressions in a list, where m is the number of parameters.
If the derivative mechanism does not know how to take the analytic derivative of a function, then it takes numerical derivatives, using the NumDeriv function. If this occurs, the platform shows the delta that it used to evaluate the change in the function with respect to a delta change in the arguments. You might need to experiment with different delta settings to obtain good numerical derivatives.
We strongly encourage you to center polynomials.
There is really no one omnibus optimization method that works well on all problems. JMP has options like Newton, QuasiNewton BFGS, QuasiNewton SR1, and Numeric Derivatives Only to expand the range of problems that are solvable by the Nonlinear Platform.
Some models are very sensitive to starting values of the parameters. Working on new starting values is often effective. Edit the starting values and click Reset to see the effect. The plot often helps. Use the sliders to visually modify the curve to fit better. The parameter profilers can help, but might be too slow for anything but small data sets.