The PValues data table contains a row for each pair of Y and X variables. If you specified a column for Group, the PValues data table contains a first column called Group. A row appears for each level of the Group column and for each pair of Y and X variables. The PValues data table also contains a table variable called Original Data that gives the name of the data table that was used for the analysis. If you specified a By variable, JMP creates a PValues table for each level of the By variable, and the Original Data variable gives the By variable and its level.
PValues Data Table, Partial View shows the PValues data table created using the Probe.jmp sample data table.
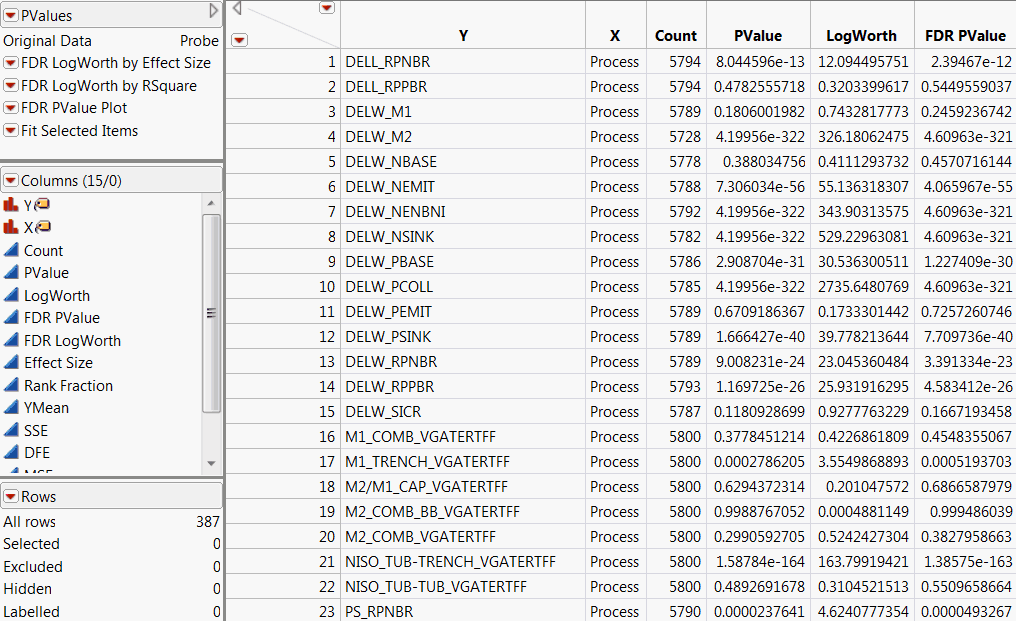
The p-value for the significance test corresponding to the pair of Y and X variables. See the Basic Analysis book for additional details about Fit Y by X statistics.
The quantity -log10(p-value). This transformation adjusts p-values to provide an appropriate scale for graphing. A value that exceeds 2 is significant at the 0.01 level (because 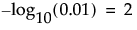 ).
).
The False Discovery Rate p-value calculated using the Benjamini-Hochberg technique. This technique adjusts the p-values to control the false discovery rate for multiple tests. If there is no Group variable, the set of multiple tests includes all tests displayed in the table. If there is a Group variable, the set of multiple tests consists of all tests conducted for each level of the Group variable. For details about the FDR correction, see Benjamini and Hochberg, 1995. For details about the false discovery rate, see The False Discovery Rate.
The quantity -log10(FDR PValue). This is the best statistic for plotting and assessing significance. Note that small p-values result in high FDR LogWorth values.
The rank of the FDR LogWorth expressed as a fraction of the number of tests. If the number of tests is m, the largest FDR LogWorth value has Rank Fraction 1/m, and the smallest has Rank Fraction 1. Equivalently, the Rank Fraction ranks the p-values in increasing order, as a fraction of the number of tests. The Rank Fraction is used in plotting the PValues and FDR PValues in rank order of decreasing significance.
The following columns are added to the PValues data table when the Robust option is selected in the launch window. The Robust option only applies when Y is continuous, so Robust column cells are empty when Y is categorical. See the Basic Analysis book for additional details about Huber M-estimation. For an example, see Example of Robust Fit.
The p-value for the significance test corresponding to the pair of Y and X variables using a robust.
The quantity -log10(Robust PValue).
The quantity -log10(Robust FDR PValue).