Select Analyze > Fit Model. Enter your Ys and model effects. Select Response Screening from the Personality list (Response Screening from the Fit Model Window).
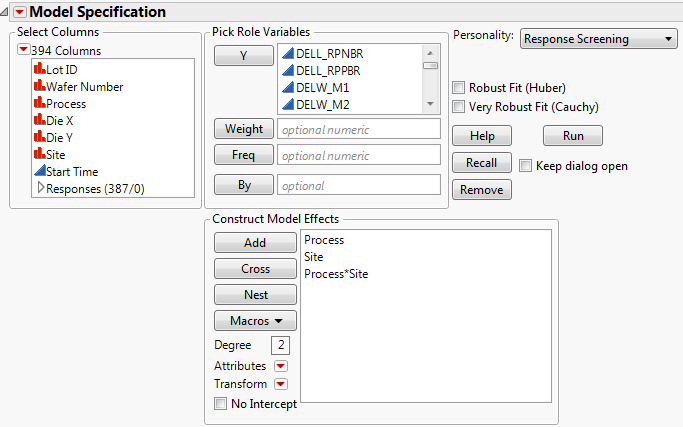
Note that a Robust Fit check box is available. Selecting this option enables robust estimation for tests involving continuous responses. These tests use robust (Huber) estimation to down weight outliers. If there are no outliers, these estimates are close to the least squares estimates. Selecting this option increases processing time.
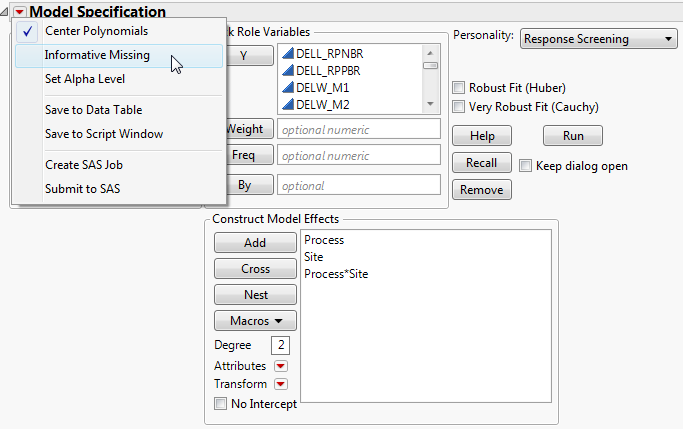
The Informative Missing option provides a coding system for missing values (Informative Missing Option). The Informative Missing coding allows estimation of a predictive model despite the presence of missing values. It is useful in situations where missing data are informative. Select this option from the Model Specification red triangle menu.
For details about the Fit Model window, see the Fitting Linear Models book’s Introduction to the Fit Model Platform chapter.
The FDR PValue Plot is interpreted in the same way as for the platform itself. SeeThe Response Screening Report.
The FDR LogWorth by Rank Fraction plot shows FDR LogWorth values plotted against the ranks of the p-values. The plotted points decrease or remain constant as rank fraction increases. The plot gives an indication of what proportion of tests are significant. An example using the Response Screening personality is given in Response Screening Personality.
Lists the Script menu options for the platform. See the Using JMP book for details.
The p-value for the significance test corresponding to the FRatio. See the Standard Least Squares chapter in the Fitting Linear Models book for additional details about Effect Tests.
The quantity -log10(p-value). This transformation adjusts p-values to provide an appropriate scale for graphing. A value that exceeds 2 is significant at the 0.01 level (because 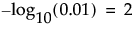 ).
).
The False Discovery Rate p-value calculated using the Benjamini-Hochberg technique. This technique adjusts the p-values to control the false discovery rate for multiple tests. For details about the FDR correction, see Benjamini and Hochberg, 1995. For details about the false discovery rate, see The False Discovery Rate or Westfall et al. (2011).
The quantity -log10(FDR PValue). This is the best statistic for plotting and assessing significance. Note that small p-values result in high FDR LogWorth values.
The rank of the FDR LogWorth expressed as a fraction of the number of tests. If the number of tests is m, the largest FDR LogWorth value has Rank Fraction 1/m, and the smallest has Rank Fraction 1. Equivalently, the Rank Fraction ranks the p-values in increasing order, as a fraction of the number of tests. The Rank Fraction is used in plotting the PValues and FDR PValues in rank order of decreasing significance.
The p-value for the overall test of model significance.
The LogWorth of the p-value for the overall test of model significance.
The rank of the Overall FDR LogWorth expressed as a fraction of the number of tests. If the number of tests is m, the largest Overall FDR LogWorth value has Rank Fraction 1/m, and the smallest has Rank Fraction 1.
These columns contain p-values for tests of each model effect. These columns are arranged in a group called PValue in the columns panel.
These columns contain LogWorths for the p-values for tests of each model effect. These columns are arranged in a group called LogWorth in the columns panel.