IDS 026
Alcohol Taste Perception Study
JMP platforms and statistical methods
Graph Builder:
Comparative line graphs, bar charts
Fit Y by X:
Analysis of variance, simple linear regression
Fit Model:
Multifactor analysis of variance
Objective
Use multifactor ANOVA and linear regression to describe how consumers’ perception of the quality of alcoholic beverages (beer, wine, bourbon) changes throughout the time of drinking it.
Problem statement
A food and beverage sensory testing laboratory has been engaged by a beverage producer to help better understand how one’s perception of the quality of an alcoholic beverage changes throughout the time of drinking it.
Three different studies were done for three different alcoholic beverages (wine, beer, bourbon).
For each beverage, a panel of 10 different tasters were selected from a pool of consumers who consider themselves to be regular drinkers of that beverage, with an average level of knowledge/ability in distinguishing quality. The tasters were told they would be drinking 16 different unknown brands across four different tasting sessions and asked to rate the quality of each on a 1-10 scale, with the scoring of 1-2: OK; 3-4: Decent; 5-6: Good; 7-8: Very Good; 9-10: Excellent. Unknown to them, however, is that they would in fact be tasting the same four brands in each session.
Experimental design
To examine how the tasters’ ratings might change across a typical drinking experience, the experiment was conducted as follows:
Four different tasting sessions were scheduled (each one a week apart).
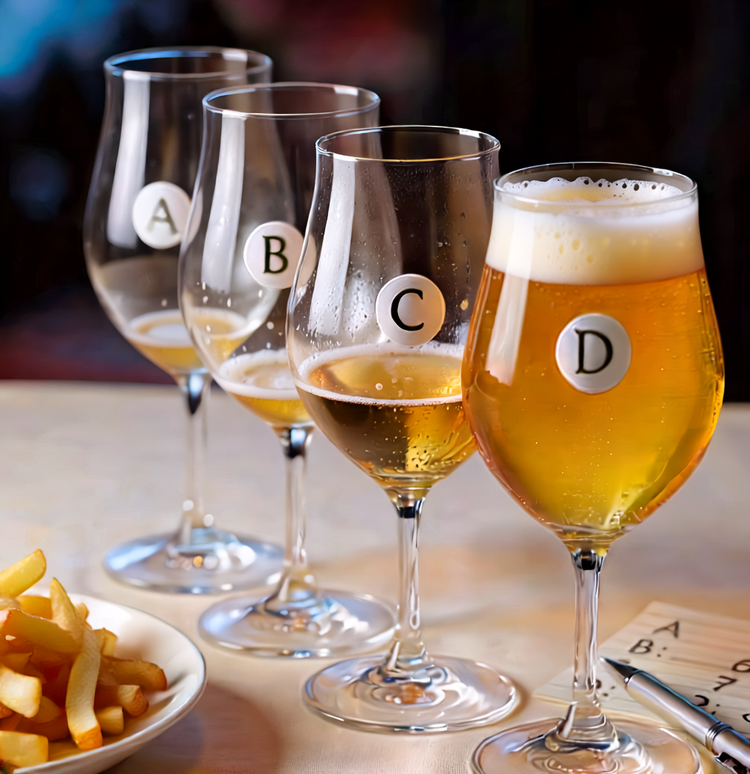
Each session consisted of the tasters drinking the four brands in a half-size serving (6 oz. for the wine and beer and 0.5 oz for the bourbon), resulting in the taster essentially having two drinks. For the wine, the tasters drank the four brands while eating a meal of pasta. For the beer, the tasters ate a beef burger and fries. For the bourbon, they ate a small serving of mixed nuts. It was designed to simulate a typical drinking experience for the beverages.