JMP platforms and statistical methods
Tabulate:
Table summary statistics
Graph Builder:
Bar chart, line graph, geographic map
Formula Editor:
Creating new variables
Objective
Analyze historical homelessness count data collected by the U.S. Department of Housing and Urban Development across states and different age groups, using data visualization techniques and descriptive statistics to make comparisons and identify trends
Problem statement
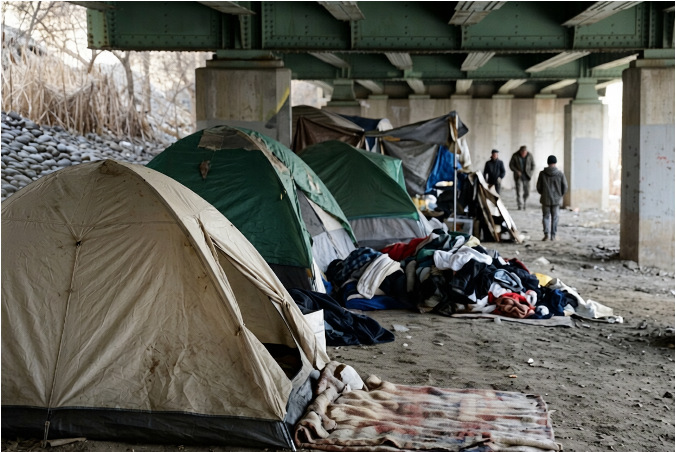
It is estimated that over half a million people are homelessness on a given night in the United States. Each year, the US Department of Housing and Urban Development (HUD) releases an Annual Homeless Assessment Report to Congress. This report provides estimates of the number and types of people experiencing homelessness across the United States including estimates of how many of those can access a shelter. Producing accurate estimates for this report is a challenging undertaking but is necessary to provide visibility into this problem, identify trends, and ultimately help lead to initiatives that try to address this troubling issue.
The focus of the analyses is to explore trends in the amount of homelessness, examining the rates of those that are sheltered vs. unsheltered, compare homelessness rates for different age groups, and examine/compare these rates at the state level.