JMP platforms and statistical methods
Formula Editor:
Creating new variables
Distribution:
Histogram, box plots; summary statistics, bar chart
Graph Builder:
Scatter plot
Multivariate:
Correlation, scatter plot matrix
Objective
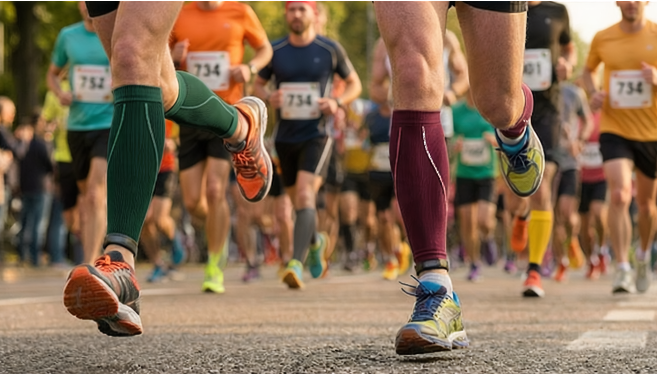
Use various visualization techniques to examine the performance of marathon runners. The objectives of the analyses will be to:
- Describe general patterns in marathon runners’ performance.
- Identify similarities and differences in running performance between male and female runners.
- Describe any differences in performance across ages of the runners.
- Compare and describe performance across different phases of the marathon.
- Identify runners that are most unique in their performance.
Problem statement
The performance of marathon runners can be influenced by many factors. Two such factors are the age and sex of the runner.
A data set of 26,598 marathon runners who finished a recent Boston Marathon was gathered. In addition to the runners’ age and sex, data on the time at which each runner reached five distances in the marathon was recorded at 5, 10, 15 kilometers, as well as 21.1 kilometers (for half marathons) and 42.2 kilometers (for full marathons).