JMP platforms and statistical methods
Graph Builder:
Comparative dot plots, 3D scatter plot
Fit Y by X:
One factor ANOVA
Multivariate:
Scatter plot matrix
Distribution:
Confidence interval for a population mean, tolerance interval, prediction interval
Objective
Use one factor analysis of variance (ANOVA) to compare physical features between different species and sexes of penguins. Use interval estimation methods (confidence intervals, tolerance intervals, and prediction intervals) to estimate the range of sizes of a feature expected for the mean, a population, and an individual penguin.
Problem statement
To better understand similarities and differences in morphological features between males and females of different penguin species, a researcher from Simon Fraser University, in collaboration with The Palmer Station Antarctica Long-Term Ecological Research Network, obtained measurements on a sample of penguins from three different species.
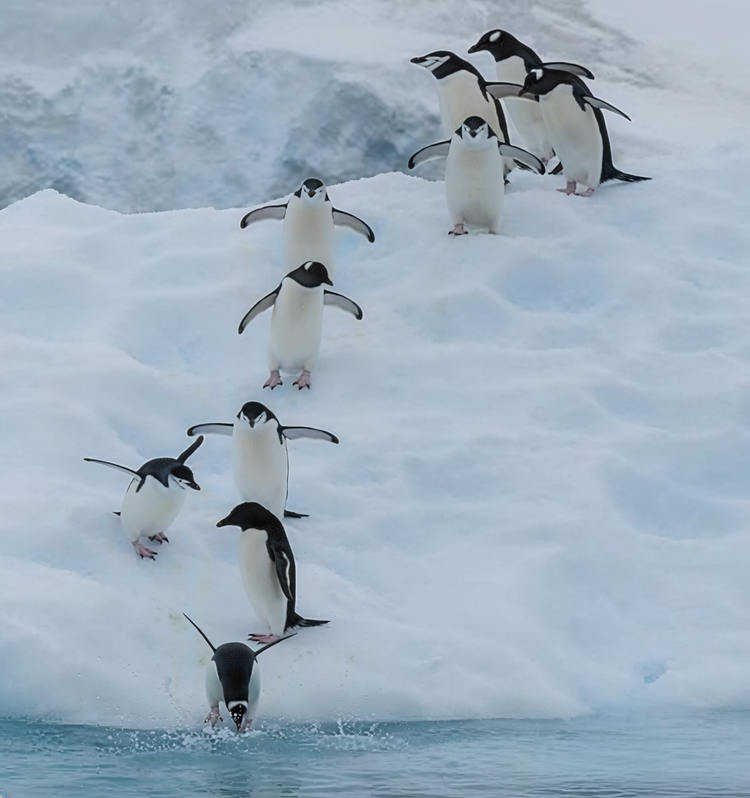
The data set consists of measurements across four physical features of 34 male and 34 female chinstrap penguins; 71 male and 72 female Adélie penguins; and 61 male and 58 female gentoo penguins.