JMP platforms and statistical methods
Distribution:
Bar chart, summary statistics, confidence interval for a proportion, confidence interval for a difference in proportions, confidence interval for ratio of proportions
Graph Builder:
Mosaic plot, shape-based heat map
Objective
Use visualization techniques and confidence intervals for proportions to examine the yield of electronic testing of integrated circuits (IC) on semiconductor wafers to identify if there are significant differences in outcomes between two methods, between the wafers within a method, and across the location of the ICs on the wafers.
Problem statement
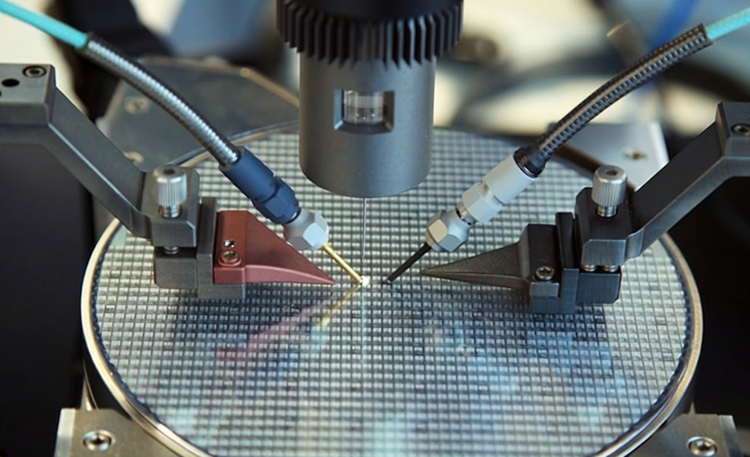
In the semiconductor manufacturing process, a silicon wafer undergoes various stages of processing to create an integrated circuit (IC) – complex electrical interconnections to perform the intended functions of the final product. Depending upon the size of the wafer and the types of ICs being formed, a wafer may contain a few hundred to thousands of individual ICs. Each of these is cut from the wafer and packaged into a device to be used in electronic products.
In the early development stage of a new IC design, the yield (percentage of functional ICs from all the ICs produced) can often be quite low. As the process matures, the yield will improve, eventually reaching a point where full-scale manufacturing of the ICs can take place.
In this example, an engineering team has run a pilot study on a new IC design by producing a total of 50 semiconductor wafers, with half of them produced using Method A and half produced with Method B, which is a quicker and less expensive process. Each wafer contains 1,300 ICs for a total of 50 x 1,300 = 65,000. Each IC undergoes a series of electrical tests to determine if it functions properly. The outcome is a binary variable indicating if the IC passed or failed the electrical testing.
The objective of the analyses will be to use graphical methods and confidence intervals for proportions to describe and compare the yield of the electronic testing to identify if there are significant differences in outcomes between the two methods, between the wafers within a method, and across the location of the ICs on the wafers.