Kolmogorov-Smirnov Test
What is the Kolmogorov-Smirnov test?
There are two Kolmogorov-Smirnov (K-S) tests commonly used in hypothesis testing: the one-sample K-S test and the two-sample K-S test. The one-sample test is used to test the hypothesis that a sample of data comes from a known distribution, for example, the normal distribution or the uniform distribution. The two-sample test is used to test the hypothesis that two samples of data come from the same distribution. You do not have to specify the form of that distribution. The test looks at the maximum difference in probability between the two distributions across all values of the data.
Example of the Kolmogorov-Smirnov test
Suppose you are interested in knowing if the distribution of particle counts is the same for two furnaces at a deposition operation in semiconductor manufacturing. Two furnaces are used to deposit a film on a substrate. The number of particles is measured for 10 runs per furnace. The data are shown in the table below.
| DEP1 | DEP2 |
| 8 | 15 |
| 3 | 25 |
| 0 | 111 |
| 0 | 27 |
| 5 | 46 |
| 2 | 3 |
| 0 | 48 |
| 4 | 59 |
| 50 | 201 |
| 0 | 0 |
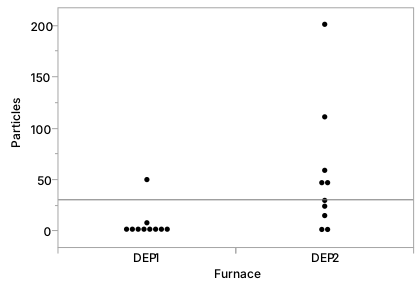
A graph of the data shows particle counts for each furnace.
The empirical distribution functions for both furnaces are shown in the figure below. The furnace DEP1 is shown by the red solid line; the furnace DEP2 is shown by the blue dashed line. The functions appear to be separated. The biggest vertical separation is used in the K-S test, when Particles = 8.
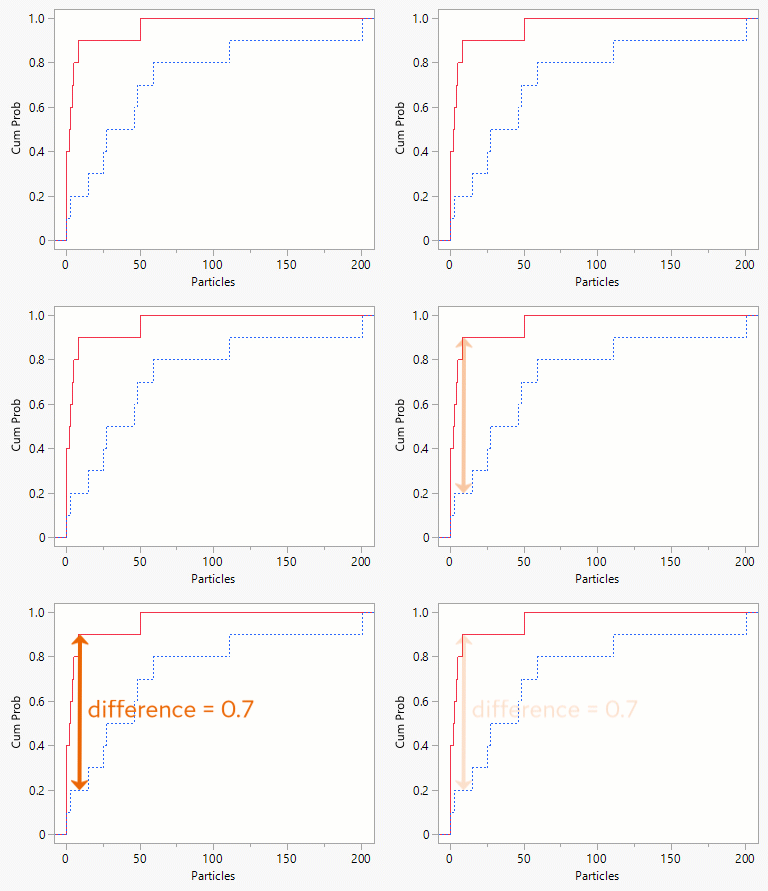
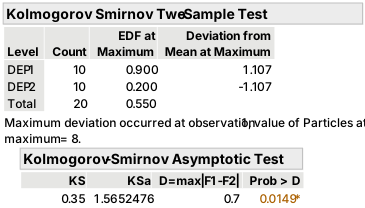
The biggest separation happens when the empirical distribution function for DEP1 is 0.9 and the empirical distribution function for DEP2 is 0.2, which gives a test statistic of $D=\max\left(\left|F_1(x)-F_2(x)\right|\right)=0.9-0.2=0.7$. The Kolmogorov-Smirnov test on the maximum difference between the distributions shows a small p-value of 0.0149. For these data, you would conclude the distributions of particle counts in the two furnaces are different.