How data visualization facilitates the analytic workflow

Keynote
Learning to see patterns in data
The visualization of data is all around – even in the most unexpected places. Data visualization expert Amoolya Singh shares how, from a young age, she saw pattern, color, dimension and depth in the brightly colored fabric of Saris. And more recently realized that these beautiful fabrics are, oftentimes, created using punch cards. In her keynote, Singh makes the connection that both science and art can take an idea or hypothesis through the whole analytic workflow, leading to rich insights and collaboration.
In her talk, you’ll learn:
- The history of computers and the history of visualization.
- How visualization enables information to be encoded and decoded.
- How to cultivate your visual senses by taking time to look at nature and art.
Panel Discussion
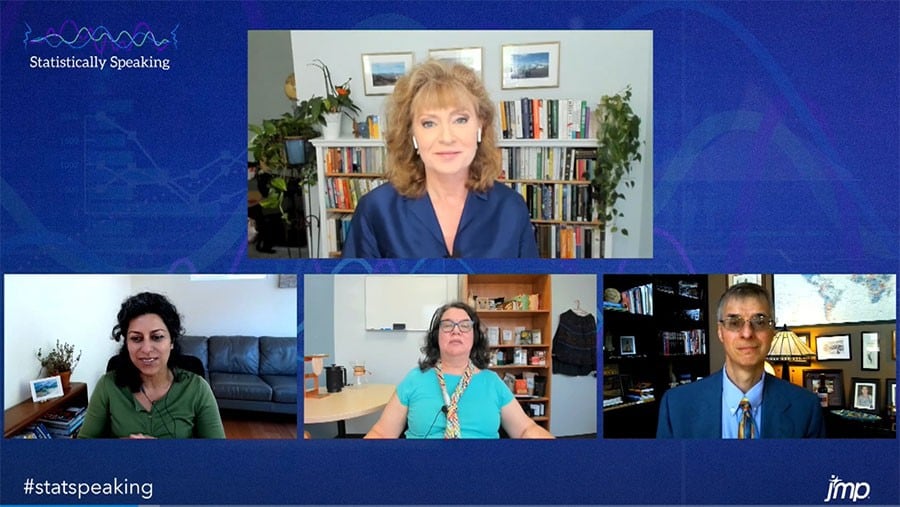
Advancing scientific discovery and innovation with leaders from Calico, Lundbeck and SAS
Data visualization can help scientists and engineers clearly understand the data before them. Learn from knowledge leaders in data visualization as they uncover the power of data visualization to expand our ability to discover and innovate.
You’ll hear from:
- Amoolya Singh, Head of Discovery Technologies, Calico Life Sciences.
- Kathleen Schneider, Senior Research Associate II, Lundbeck.
- Scott Wise, Principal Systems Engineer, JMP.
Register to watch the panel discussion
