Analytically Speaking
Want to Make More Effective Graphs?
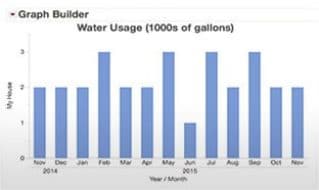
With Xan Gregg
Data visualization is our most efficient tool for understanding information, but it’s far from perfect. Xan Gregg, JMP Director of R&D at SAS and the creator of the Graph Builder, shares how an understanding of visual perception can help you make more effective data visualizations.
In this video:
- The distinction between data visualization and information visualization.
- Ways to create graphs that align with the senses.
- How good visual design is as important as good grammar.
- Tips for giving a graph a makeover.
- Why you should share your research data.