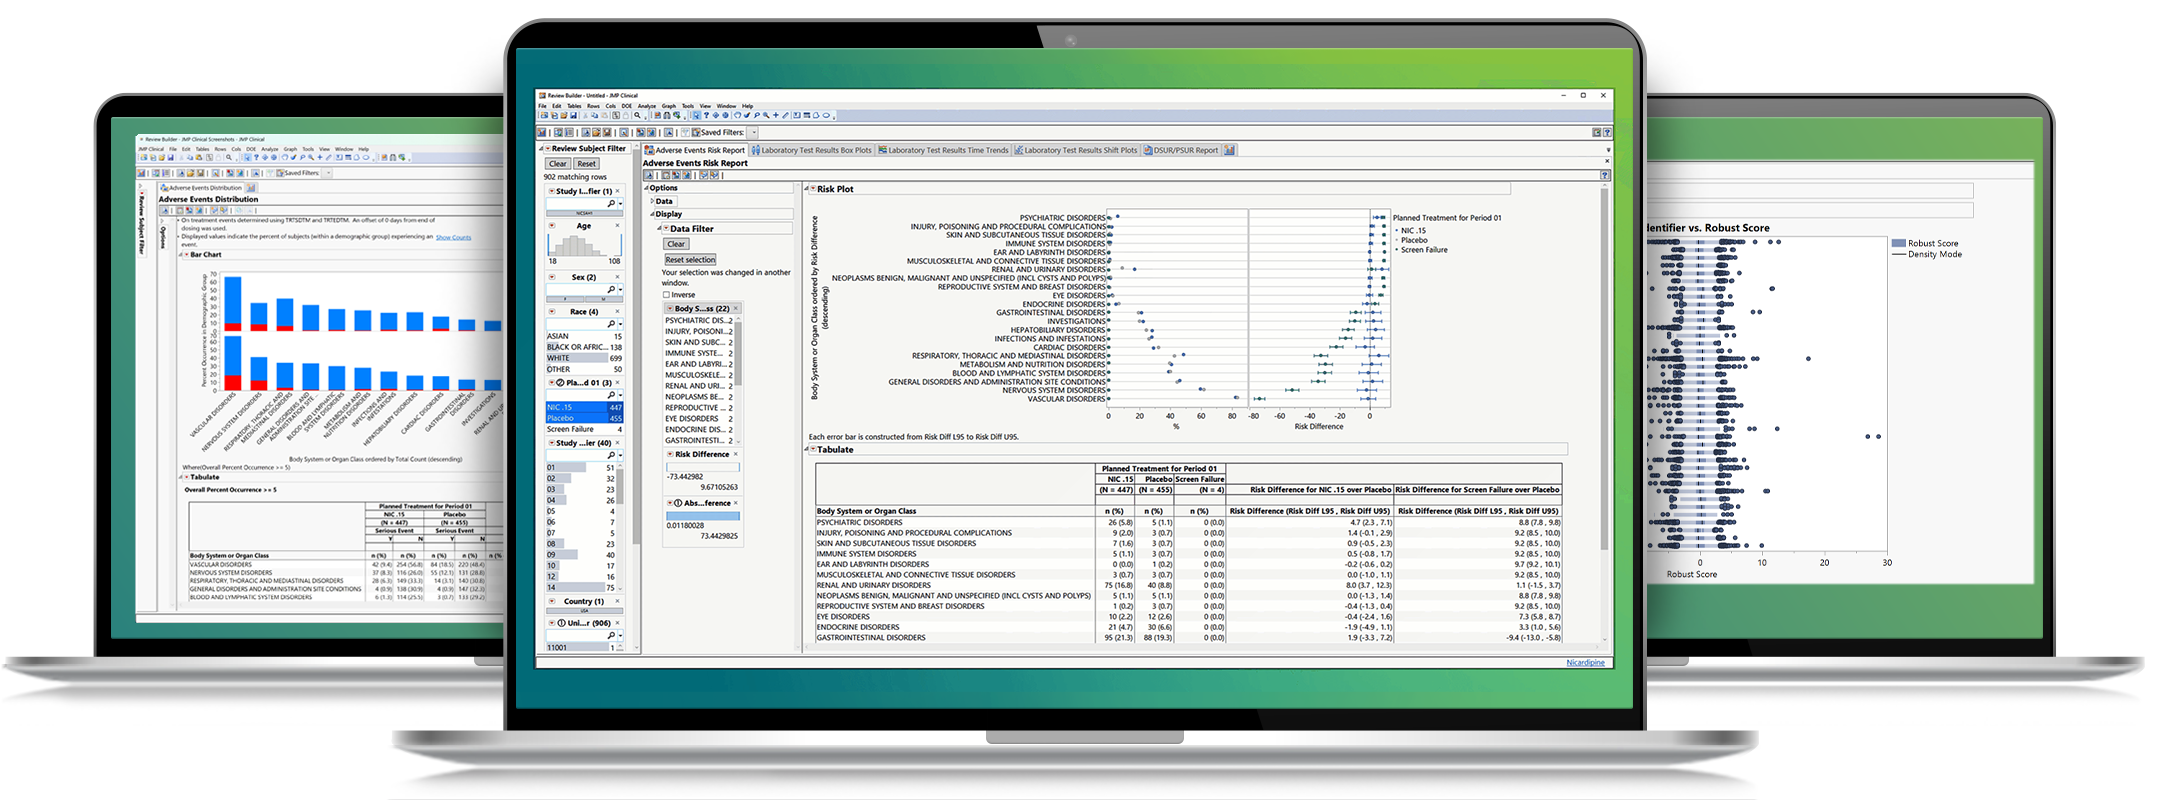
Core Capabilities of JMP® Clinical

JMP Clinical gives you the tools to simplify the analysis and reporting of clinical trials data.

Risk-Based Monitoring

Risk-based monitoring tools in JMP Clinical promote the paradigm shift toward more efficient clinical trial review, reducing costly on-site source data verification while preserving data integrity and the safety of study participants.

Using standard CDISC data formats, JMP Clinical allows centralized data monitoring teams to evaluate risk efficiently with reliable statistics and intuitive visualization. Risk metrics derived from recommendations by TransCelerate BioPharma, a consortium of pharmaceutical and biotech companies, provide a foundation for assessment. Simple customization makes it easy to add or modify metrics based on the nature of trial sites and study populations.

Site-level tables deliver color-coded risk levels at a glance, allowing easy identification of any sites requiring immediate attention. Geospatial maps show site- and country-level clinical trials risk, providing additional insight into potential clinical trial problems such as environmental conditions or training programs.

Data snapshot comparison features track all changes over time, allowing clinicians, statisticians and data managers to focus on new or modified data. Data monitors can easily compare performance before and after site interventions.

Risk-based monitoring capabilities integrate seamlessly with JMP Clinical features such as Patient Profiles and Adverse Event Narratives, making it easy for monitoring personnel to look more closely at sites with identified risks.

Data Integrity

The success of any clinical trial depends on the accuracy and integrity of the study process and the data produced from the trial. Detecting inadvertent errors and fraudulent data is paramount at every step.

Classic monitoring strategies rely on on-site visits and source data verification, which are expensive and of limited value. JMP Clinical offers unique tools for summarizing clinical trials data in a way that makes it easy to identify unintentional or intentional errors in data about individual subjects or clinical sites.

With JMP Clinical, you don’t need to be a statistician or a programmer to detect fraud or data quality problems. Using CDISC data, JMP Clinical conducts statistical analyses and presents results visually. Its interactive paradigm makes it easy to share and explore your findings. Data integrity capabilities in the software help you identify and address issues at both the site and patient level, and include methods to:

Site misconduct
  • Determine the distribution of patients who report for study visits on weekdays and holidays.
  • Identify sites with subjects whose attendance meets schedules all too perfectly.
  • Identify sites that report no variability in results of findings like lab tests, vital signs and more.
  • Identify unusual patterns using statistical techniques with multivariate inliers and outliers.
  • Analyze findings data for inconsistencies in last-digit preference across sites.
  • Calculate pairwise correlations between tests within each findings domain and identify unusual results at specific study sites.
  • Determine whether enrollment patterns within each site appear unusual.
  • Identify unusual frequencies across the entire study or by study visit.
  • Determine whether individuals are missing data for all test codes across all findings domains.
  • Identify outliers and sites with excessive (or too few) outliers.
  • Identify regression to the mean in assessing study entry criteria.
  • Identify unusual summary statistics across the entire study or by study visit.
  • Determine whether patient recruitment goals will be met by a specified deadline and, if not, identify the number of additional centers to recruit.
Patient misconduct
  • Identify patients with identical birthdays and initials.
  • Identify duplicate sets of patient measurements, such as systolic and diastolic blood pressure and heart rate.
  • Cluster subjects within study sites to identify similarities that could indicate fabrication of patients.
  • Cluster subjects across study sites to identify persons registering at multiple sites.

Data Visualization and Analysis

During clinical trials, JMP Clinical organizes the review process, working behind the scenes to automate the analytics and reporting so reviewers have more time to interpret and understand the results. Its visual paradigm speeds discovery, revealing trends and outliers that spreadsheets tend to hide.

Data monitors can evaluate data from ongoing, blinded trials for safety issues with the click of a button, creating summary dashboards of adverse events, concomitant medications, labs and vital signs with the ability to drill down to customized patient profiles and patient narratives. Monitors share these reports in PDF or RTF format with medical writers, who tailor the final study reports. At any point, biostatisticians can evaluate statistically significant differences due to age group, sex, race or site using sophisticated pattern discovery or predictive modeling analyses.

By using standard CDISC data – the format for clinical analysis and reporting preferred by the FDA – as well as standard reviewer guidances and standard visualizations, the software streamlines the exploration, review and submission of clinical trials data to the FDA.

Data Monitoring

Designed in collaboration with data monitors, summary dashboards in JMP Clinical enable clinicians to evaluate data from ongoing, blinded trials for safety issues with the click of a button, creating interactive reports of adverse events, concomitant medications, labs and vital signs with the ability to drill down to customized patient profiles and patient narratives.

  • Identify serious adverse events associated with treatment or other subject-level criteria.
  • Look at concomitant medications associated with adverse events or treatments.
  • Visually identify changes over time of lab, vital signs or other findings using time trends and shift plots.
  • Generate patient profiles or patient narratives automatically for data monitoring committee meetings or clinical study reports.
  • Identify patients at serious risk of liver failure.

Biometrics and Biostatistics

By combining the most sophisticated statistical algorithms with innovative visualizations, JMP Clinical allows biostatisticians to dig deep into clinical events, findings and interventions from a clinical trial.

Bayesian hierarchical models, unique in JMP Clinical, find rare adverse events that might put a clinical trial at great risk. These models complement our incidence screens analyses based on more commonly used frequentist methods.

  • Screen the risk of all of your adverse events, general events or interventions categorical data using incidence screen algorithms.
  • Utilize the new Adverse Event Bayesian Hierarchical Model to compare with the more frequentist incidence screen analyses in the software.
  • Identify clusters or correlations with our pattern discovery methods.
  • Optimize treatment or other characteristics of the trial using sophisticated predictive modeling techniques.

Patient Profiles and Narratives

Automated patient profiles and patient narratives reduce the time and complexity of creating output for review and submission both internally as well as to the FDA and other regulatory agencies. Along with summary dashboards of events, findings and interventions, these features enable medical officers to quickly generate hypotheses about particular groups or subgroups within the study population.

The Review Builder app loads data and reports into a simple user interface, eliminating frustration and wasted time for medical officers who need access to the data but don’t want to learn a new system. With a single click, clinicians can gain access to patient profiles and narratives.

JMP Clinical lets medical officers instantly generate patient profiles for an individual or group of subjects simply by selecting subjects, and it displays clinical results visually, making it easier for nonstatisticians to understand. Patient profiles are customizable, displaying data from any combination of the core safety domains. Once the reports are tailored, users can save the view as a template or can print the report in PDF or RTF, making for straightforward communication of findings among review groups.

JMP Clinical can compose a configurable patient narrative for each subject who experienced a serious adverse event during the clinical trial. Reviewers and medical writers enjoy the speed of this programmed process, using the write-ups as a starting point for the final patient narratives compiled in the Clinical Study Report (CSR) required by the FDA.

Interventions

The Exposure Summary process identifies differences in dose and duration of exposure across treatment groups, providing context for all downstream analyses. JMP Clinical includes options to choose the number of dosing groups and the duration of the time window. Incidence screens of concomitant medications and substance use allow clinicians to identify drug-drug interactions. Following FDA Reviewer Guidance principles and ICHE3 guidelines, with a focus on adverse events, JMP Clinical enables analysis of distributions, event rates and estimations of risk over time for blinded and unblinded data. Clinicians can easily select subgroups with Distribution dashboards that summarize by age, sex, race, treatment group and site.

Events

With JMP Clinical, you can determine the onset of an adverse event and its outcomes with time-to-event analyses and resolution screening, respectively. Various time-to-event analyses, such as Time To Discontinuation, are available with the click of a button. JMP Clinical facilitates time windowing in most analyses, and the AE Resolution Screen lets you monitor adverse event outcomes during a specified time window.

Incidence screens, the principal safety analyses for adverse event identification, perform a Cochran-Mantel-Haenszel test, yielding volcano plots of multiplicity-adjusted p-values by risk difference, relative risk or odds-ratio. The bubble size indicates the total incidence of an event that occurs for both treatments combined. Select adverse events (bubbles) of interest to determine the frequency of co-occurrence in the study population using a Venn diagram.

JMP Clinical supports the MedDRA hierarchy, allowing examination of any term level, including Standardized MedDRA Queries, to help you discern adverse event patterns across treatment groups. The software also lets you compare the incidence of any of these term levels across the duration of the trial.

Findings

Determining treatment compliance and establishing baseline values for lab measurements is important for all clinical reviewers. Often these data provide the means to determine both efficacy and safety evaluations. JMP Clinical equips medical reviewers with analyses for both measures of central tendency and outlier detection so that they can quickly identify potentially harmful symptoms that develop during the clinical trial.

Nearly all of the visualizations recommended in the FDA Reviewer Guidance are available in JMP Clinical without any programming, including distribution displays, box plots, shift plots, time trends, scatterplots as well as change from baseline. In addition, our volcano plots offer a simplified but uniquely comprehensive view of relative risk data that shows changes over time.

JMP Clinical evaluates liver toxicity, a primary safety focus of clinical trials, by identifying subjects who meet the Hy’s Law criteria described in the Drug Induced Liver Injury Guidance document set by the FDA. An industry-standard scatterplot matrix displays Hy’s Law along with a mosaic plot to confirm the number of days subjects experienced elevated liver test measurements. Finally, a tabular report in the dashboard display shows the number of subjects who missed the laboratory tests necessary for Hy’s Law determination.

Key Features of JMP® Clinical


Studies
  • Add studies containing CDISC-formatted SDTM and/or ADaM data from SAS data sets or transport files.
  • Create ADSL data sets and other types of ADaM data on the fly by collecting relevant slices of SDTM data.
  • Rename a study or its associated folders and delete unnecessary studies or portions of studies.
  • Check SDTM and ADaM folders for variables required by JMP Clinical analytical processes, and produce a table of results indicating missing variables and affected processes.

Risk-Based Monitoring
  • Add and customize risk metrics to suit the risk management plan of each clinical trial.
  • Incorporate additional data into risk-based monitoring analysis such as query information, active enrollment dates, primary site monitor, and geographical information.
  • Examine the distribution of risk indicators with histograms and box plots.
  • Quickly identify sites in need of further attention with site-level risk tables, color-coded using the traffic-light system proposed by TransCelerate BioPharma.
  • Visualize site- and country-level risk indicators geographically with color-coded geospatial maps.
  • Cluster sites by risk metrics to identify sites with similar problem areas.
  • Focus on new, modified, or unmodified records with data snapshot comparisons. View variable changes within record-level notes automatically generated by JMP Clinical, or create and save your own. Examine records that were dropped from the current snapshot, and any records that may be duplicates.
  • Export and import tables containing specific sites to allow division of labor between many data monitors.

Data Integrity
Site misconduct
  • Determine the distribution of patients who report for study visits on weekdays and holidays.
  • Identify sites with subjects whose attendance meets schedules all too perfectly.
  • Identify sites that report no variability in results of findings like lab tests, vital signs and more.
  • Identify unusual patterns using statistical techniques with multivariate inliers and outliers.
  • Analyze findings data for inconsistencies in last-digit preference across sites.
  • Calculate pairwise correlations between tests within each findings domain and identify unusual results at specific study sites.
  • Determine whether enrollment patterns within each site appear unusual.
  • Identify unusual frequencies across the entire study or by study visit.
  • Determine whether individuals are missing data for all test codes across all findings domains.
  • Identify outliers and sites with excessive (or too few) outliers.
  • Identify regression to the mean in assessing study entry criteria.
  • Identify unusual summary statistics across the entire study or by study visit.
  • Determine whether patient recruitment goals will be met by a specified deadline and, if not, identify the number of additional centers to recruit.
Patient misconduct
  • Identify patients with identical birthdays and initials.
  • Identify duplicate sets of patient measurements, such as systolic and diastolic blood pressure and heart rate.
  • Cluster subjects within study sites to identify similarities that could indicate fabrication of patients.
  • Cluster subjects across study sites to identify persons registering at multiple sites.

Workflows
  • Perform a complete set of standard safety data analyses with only a few mouse clicks.
  • Build custom workflows.
  • Create a journal file containing results of user-specified processes.

Demographics
  • Compare distributions of demographic variables across treatment arms via a one-way ANOVA or contingency analysis.

Interventions
  • Generate a summary of drug exposure duration for subjects across an entire study or a specified time window.
  • Compare distributions of concomitant medications and substance use variables across treatment arms.
  • Perform an incidence analysis of concomitant medications or substance use between two or more treatment groups, producing a volcano plot of relative risk, risk difference or odds ratio.

Events
  • Create Kaplan-Meier survival curves and associated statistics, grouped by treatment arm.
  • Compare cause-of-death frequencies between treatment arms via a contingency analysis.
  • View distributions of adverse events, subject disposition or medical history across treatment arms.
  • Perform an incidence analysis of all adverse events or Standard MedDRA Query terms across two or more treatment groups to produce a volcano plot of relative risk, risk difference or odds ratio. Optionally perform the incidence screen using the Double FDR methodology of Mehrotra and Adewale (2011) to discover true signals by incorporating a grouping variable, such as body system, into the analysis.
  • Analyze incidence of adverse event resolution across treatment arms.
  • Perform adverse event severity ANOVA to explore severity that differs between time periods and/or treatment groups.
  • Create tabular and graphical overviews of treatment-emergent adverse events for the safety population by treatment arm.
  • Determine time to first occurrence of an adverse event, performing log-rank and Wilcoxon tests between treatment groups.
  • Generate adverse event narratives for clinical study reports with options to capture all adverse events within specified time frame surrounding event start date.
  • Perform an incidence analysis of disposition or medical history across two or more treatment groups and produce a volcano plot of relative risk.

Findings
  • Compare distributions of laboratory, vital signs and ECG findings across treatment arms.
  • With baseline ANOVA, efficiently screen all findings measurements that differ across treatment groups over the entire study or for a defined time window.
  • Display shift plots to compare test measurements for a specified findings domain at baseline versus on-therapy values and perform a matched pairs analysis.
  • Display box plots by treatment group representing the change from baseline in measurements for each test across various specified time windows or points in the study.
  • Visualize time trends for findings measurements for each subject across the timeline of the study.
  • Track a pair of findings measurements over time with an animated bubble plot and select subjects of interest to display their time profiles.
  • Define events using one or more findings tests to be analyzed in a time-to-event analysis.

Hy’s Law Screening
  • Visualize peak values over the duration of a study for lab measurements pertaining to Hy’s Law for detecting potential liver toxicity for all subjects across treatment arms.
  • Calculate number of days subject experiences elevated liver test measurements to identify individual Hy’s Law cases.
  • Perform contingency analysis to compare the incidence and frequency of potential liver toxicity across treatment arms, which may be used to evaluate the possibility of drug-induced liver injury (DILI).
  • Tabulate number of subjects with missing lab tests.

Standard Reports
  • Generate a study visit attendance report, various standard safety reports and a report of study comments in RTF and PDF formats.

Profile Subjects
  • Examine patient profiles from any CDISC domain.
  • Drill down to view demographics, disposition, safety, findings, medical history and comments for any subject.
  • Profile multiple subjects simultaneously, side by side.
  • Create customized patient profile templates.
  • Create a PDF report and adverse event narrative from drill-down views.

Other Subject Utilities
  • Cluster subjects to search for hidden patterns in interventions, events and findings within or across domains.
  • Create interactive Venn diagrams with up to five variables.
  • Tailor data views using complex queries.
  • Apply a subject filter to any analytical process.
  • Visualize the distribution of review status for the subjects in a study.
  • Create cross-domain data suitable for clustering, pattern discovery and predictive modeling.


System Requirements

JMP Clinical runs on Microsoft Windows.