Bar charts with error bars
JMP® Screenshots
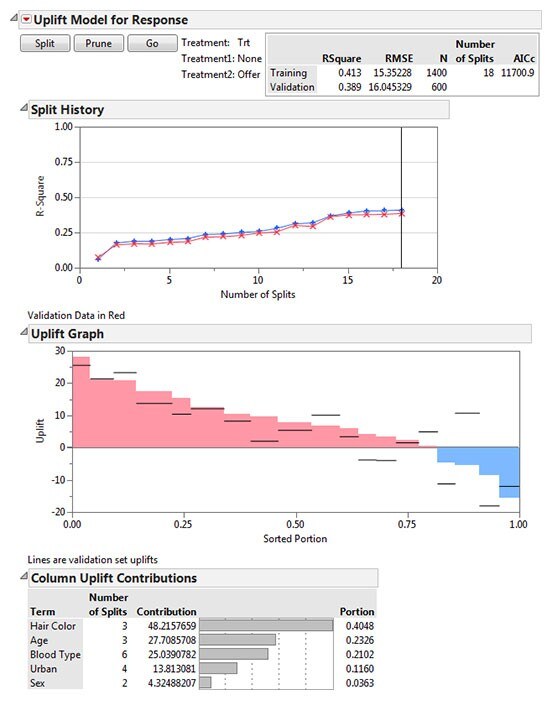
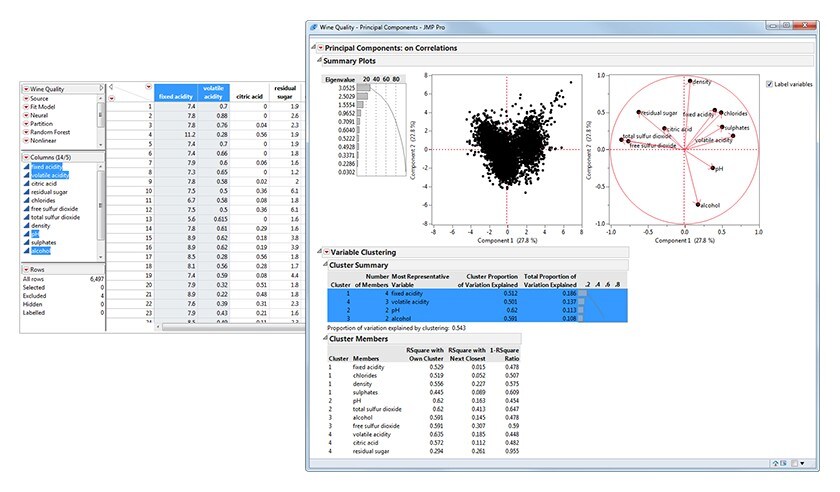
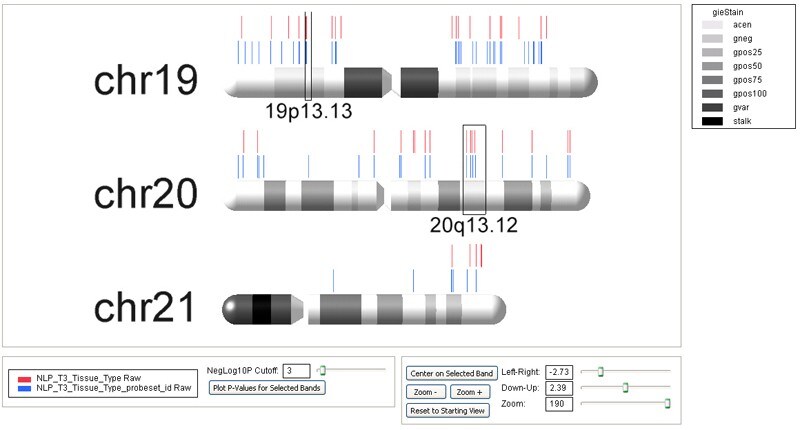
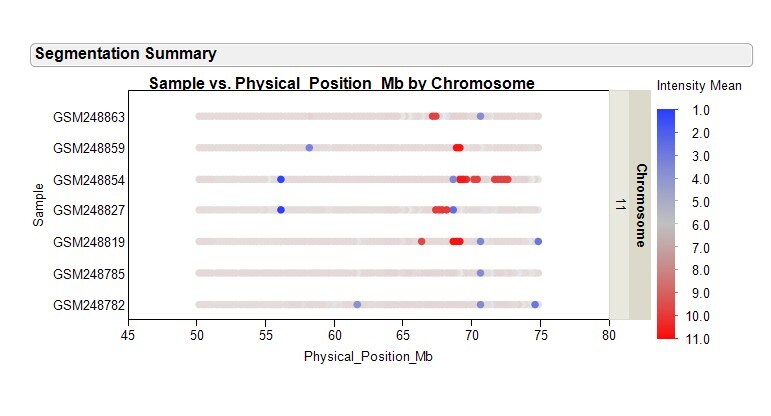
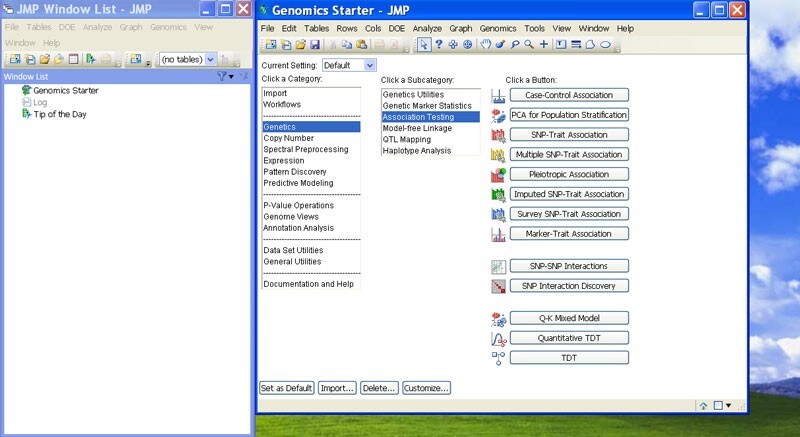
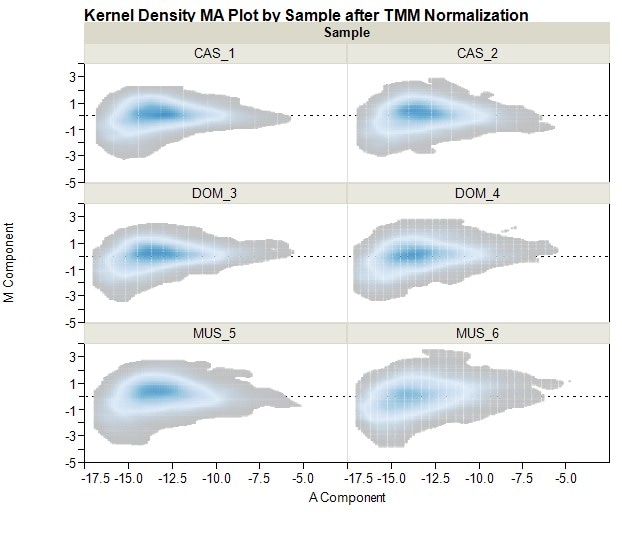
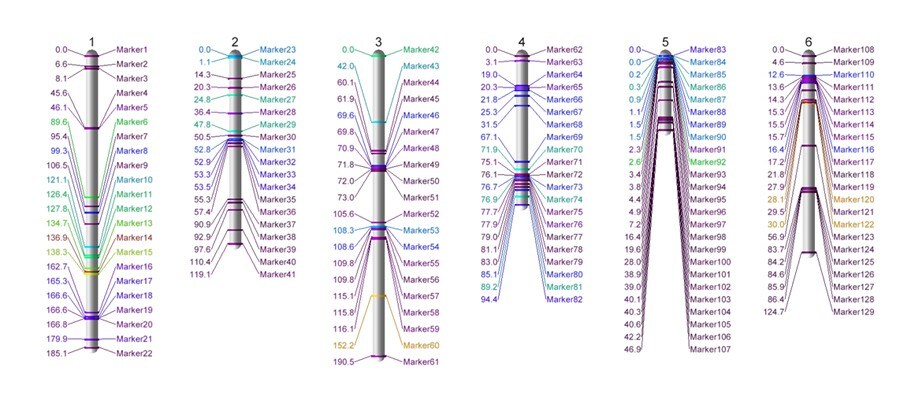
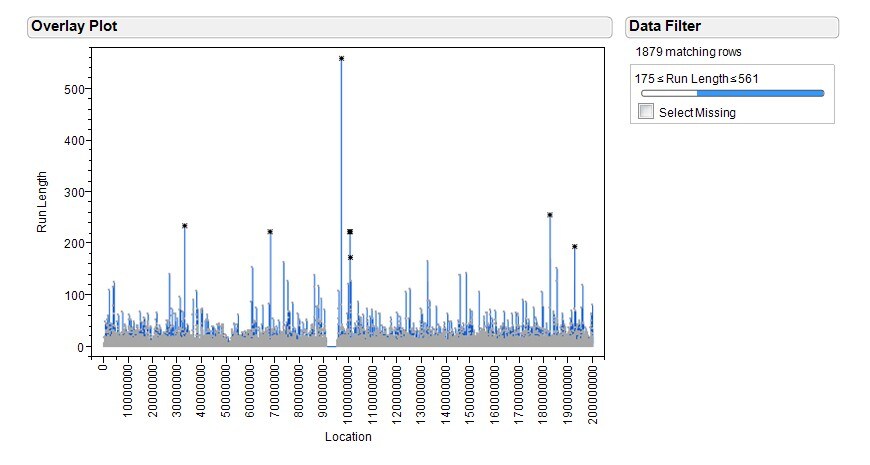
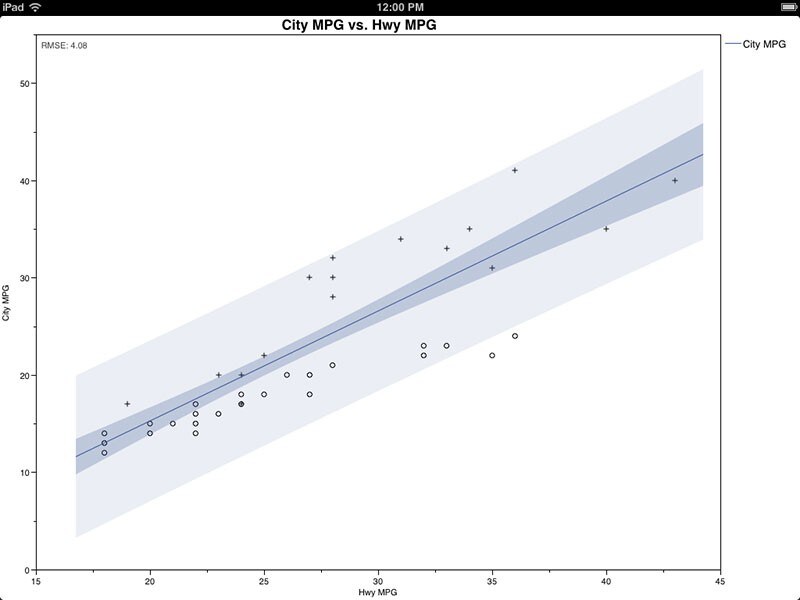
This collection of screenshots provides a sampling of capabilities and features from each of the products in the JMP family.

JMP - Box plots and other types of graphs are available from Graph Builder.

Box plots

JMP - Visualize changes over time using Bubble Plots.

Bubble plots

JMP - Analyze process capability using the Distribution platform.

Capability analysis

JMP - Conduct chi square tests for two variables using Fit Y by X.

Chi square tests

JMP - A collection of interactive learning modules help you learn and teach statistical concepts. One of the available Interactive Learning Tools.

Confidence interval learning module

JMP - Create a contingency table and mosaic plot using Fit Y by X.

Contingency table (cross tabulation)

JMP - Create a variety of control charts for continuous or attribute data, and conduct a capability analysis, using the Control Chart platform.

Control charts and process capability

Build custom menus to quickly access your data or custom applications.

Create add-ins and customize menus (Add-in Builder)

Create custom JMP applications using the Application Builder.

Custom applications (Application Builder)

Customize summary statistics in the Distribution platform to display the statistic you’re looking for.

Customize summary statistics

The Partition platform provides interactive classification and regression trees.

Data mining – classification tree (Partition)

Construct neural networks using the Neural platform.

Data mining – neural networks

The DOE menu provides a wide variety of experimental designs, including full factorial, screening, response surface, split plot and custom designs.

Design of experiments (DOE)

Analyze industrial experiments, view interactions and optimize with the Fit Model analysis platform.

Design of experiments (DOE) – response surface

Use the Screening platform to analyze two-level screening experiments.

Design of experiments (DOE) – screening analysis

Calculate and display probabilities and percentiles for a variety of distributions. One of the available Interactive Learning Tools.

Distribution and probability calculator

Interactively summarize your data using Tabulate.

Drag-and-drop pivot tables

All graphical displays and the data table are linked.

Dynamically linked graphs and data

The Excel Import Wizard allows you to get an analysis-ready JMP table from your Excel workbooks in just a few steps.

Excel Import Wizard

Perform factor analysis with Principal Components or Maximum Likelihood and multiple rotation methods.

Factor analysis

The Nonlinear platform can fit curved data without the need to pre-impute a formula or starting values. Simply select from one of the models in a rich library, which includes popular bioassay or pharmacokinetic models, and data is fit automatically.

Fit Curve (Nonlinear platform)

Use the reliability Fit Life Distribution platform to fit and compare a variety of distributions.

Fitting distributions

Use Fit Model and other JMP platforms to generate SAS code.

Generate SAS code

Hierarchical and KMeans clustering are available from the Multivariate platform.

Hierarchical clustering

Create interactive histograms and display customizable summary statistics using the Distribution platform.

Histograms and summary statistics

Use the JMP Excel Add-in to create a JMP data table from an Excel spreadsheet.

Import Excel data into JMP

Send data to MATLAB, execute code and return data to JMP for visualization and analysis. The interface lets JMP seamlessly integrate with MATLAB to extend JMP further for even greater analytic power and flexibility.

Interface to MATLAB

Dynamically explore and visualize Excel models in JMP using the Excel Profiler.

JMP add-in Excel Profiler

Use Fit Y by X or Fit Model for nominal or ordinal logistic regression.

Logistic regression

Use Graph Builder to plot data geographically.

Mapping from Graph Builder

The Measurements Systems Analysis (MSA) platform provides an all-in-one method for assessing the variation in your measurement system and gauges.

Measurements systems analysis (MSA)

Analysis of covariance with the Fit Model platform.

Models with continuous and categorical predictors (ANCOVA)

Multiple regression with Fit Model.

Multiple regression

Multivariate analysis of variance with the Fit Model platform.

Multivariate analysis of variance (MANOVA)

Conduct hypothesis tests and construct confidence intervals using Distribution.

One-sample t-test and confidence intervals

Use Fit Y by X for ANOVA and multiple comparison procedures, such as Tukey HSD.

Oneway ANOVA and Tukey HSD

The Prediction Profiler is ideal for model exploration, optimization and Monte Carlo simulations.

Optimization and Monte Carlo simulation

Use the Matched Pairs platform to compare means for paired responses.

Paired t-test

Pareto plots and other quality tools are available from the Quality and Process menu.

Pareto plot

The Partial Least Squares (PLS) platform has rich graphics and detailed reports.

Partial least squares (PLS)

Fit and explore polynomial models using Fit Y by X.

Polynomial regression

Explore variation explained by each principal component using the Principal Components platform.

Principal components analysis

Graphically explore relationships between variables using Graph Builder.

Regression with grouping variable

A variety of residual plots are available using Fit Y by X and Fit Model.

Residual analysis

Run R code from JMP. Download Multidimensional Scaling, and other R add-ins, from jmp.com/addins.

Running R Code from JMP

Explore correlations between variables using the Multivariate platform.

Scatterplot matrix and correlations

Easily save your work and create custom applications using the JMP Scripting Language (JSL).

Scripting in JMP

Plot continuous data using Fit Y by X, and then fit a line or another regression model.

Simple linear regression

Use smoothing splines in Fit Y by X to dynamically explore the underlying model.

Smoothing splines

Choose the Stepwise personality in Fit Model for stepwise regression, all possible models, and model averaging.

Stepwise regression

Plot location-based data on background maps, which now can include a street-level view.

Street-level maps

Analyze complex surveys with complete control of question structures, report presentation and statistical tests performed.

Survey analysis

Use the reliability Survival platform to explore and model survival (or failure).

Survival analysis

The Time Series platform includes ARIMA, Seasonal ARIMA, smoothing models and more.

Time series analysis

Transform variables in a single click in any platform launcher, in the data table, in Graph Builder and through JSL.

Transform variables

Use Fit Special in Fit Y by X to fit a model using a transformation.

Transformations

Use Fit Y by X to conduct a two-sample t-test or other statistical tests.

Two-sample t-test

The advanced neural network capabilities in JMP Pro include the choice of three activation functions and two layers, a choice of validation methods, as well as gradient boosting.

Advanced neural modeling

Advanced features for partial least squares (PLS) regression in the Fit Model platform. Model effects can include categorical factors, as well as crossed and polynomial terms.

Advanced partial least squares (PLS)

Build cross-validated boosted decision-tree models, which build many simple trees, repeatedly fitting any residual variation from one tree to the next.

Boosted trees

The bootstrap forest technique grows dozens of decision trees using random subsets of the available data and then averages the computed influence of each factor in these trees.

Bootstrap forest

Stepwise regression includes the option of stopping rules based on cross-validation.

Cross-validated stepwise regression

JMP Pro includes advanced computational methods for performing exact measures of association and oneway nonparametric exact tests.

Exact tests

Use Generalized Regression in JMP Pro to build better predictive models despite data challenges.

Generalized regression

Compare the effect of different architectures on a neural fit with boosting (left) and without (right).

Gradient boosted neural model

Partial least squares (PLS) regression can impute missing data before fitting.

Missing value imputation for partial least squares regression

Build and fit mixed models to analyze data that involves both time and space.

Mixed models

Model comparision provisions for comparing fits across multiple fit predictions.

Model comparison

Build multi-layer, cross-validated neural network models with numerous architectures.

Multi-layer neural network model

Bootstrap any statistic in a JMP report with a single click. This example shows bootstrapping confidence limits around a 10th percentile quantile.

One-click bootstrapping

Use the Reliability Block Diagram for complex system design and to locate and address weaknesses in the system.

Reliability block diagram

Uplift models identify the consumer segments most likely to respond favorably to an offer or treatment.

Uplift modeling

Easily split your data into training, validation and test portions for honest assessment of a model’s predictive ability.

Validation column role for cross-validation

Use variable clustering for quick and easy dimension reduction to make your prediction problems easier to solve.

Variable clustering

Severity analysis of adverse events shows differences across treatment groups via dynamically linked graphs.

Adverse Events Analysis

Tree maps like this one can show whether drug-event pairs meet signal criteria.

Adverse Events Tree Map

A simplified Starter menu helps users easily choose specific reports and analyses for dynamic visual exploration.

Clinical Starter

From one-way plots, select subjects of interest and drill down again to patient profiles.

Drill down to patient profiles

This distribution shows duration of exposure for all subjects in the trial.

Exposure Distribution

A Hierarchical Cluster report with two-way clustering identifies relationships between individual subjects and the events, findings and interventions included in the safety analyses for the study.

Hierarchical Clustering

A two-dimensional hierarchical cluster shows relationships between selected events, findings or observations.

Hierarchical Clustering

Zoom in to select subjects in the Hy’s Law region. Drill down on selected subjects to see patient profiles or subject clusters.

HY's Law Region

The default view for the JMP Clinical bubble plot is a representation of Hy’s Law analysis, showing changes across treatment groups over time for any lab.

Hy's Law analysis using Bubble Plot

The industry-standard Hy’s Law display in JMP Clinical is interactive for selection of subjects. A dashboard containing a scatterplot matrix of transaminases and bilirubin; mosaic plot of days until bilirubin elevation and missing lab tests report tab.

Hy's Law Dashboard

The mapping feature in Graph Builder lets you choose any variable for geographic display.

Mapping with Graph Builder

A new medical monitors dashboard in JMP Clinical 4 displays frequency and count information for adverse events.

Medical monitors dashboard

Use Graph Builder’s Mosaic Plot to compare adverse events, here from the vascular body system, by sex across treatment groups.

Mosaic Plot

Use the zoom tool in JMP Clinical to magnify clusters of interest, and then run a partial correlation analysis on any items in the cluster.

Partial correlation cluster analysis

A patient profile dashboard allowing configuration of clinical information, notes for reviewers and printing to PDF documents.

Patient Profile

Easily display the relative risk of significant adverse events.

Risk analysis of adverse events

In this bubble plot, time windows show the change in significance and relative risk for all adverse events and concomitant medications for each day of the trial.

Risk Bubble Plot

From the volcano plot, drill down to a relative risk plot to sort easily by count, relative risk, significance or dictionary-derived terms.

Risk Plot

From the severity analysis, select significant adverse events and drill down to the subject level with one-way plots.

Severity analysis

A trellis plot graphs trends for selected subjects of interest.

Trellis plot

From the volcano plot, a Venn diagram helps identify co-occurring adverse events for subjects in the study. Then select subjects for clustering or profiling.

Venn Diagram

Use paired RNA expression and DNA hybridization data to screen for indications of allele-specific expression with the new Allele Specific Expression Filter process. Examine a summary volcano plot, then drill down to display detailed information for specific SNPs.

Allele Specific Expression Filter process

Overlay continuous variables such as p-values, intensities, counts or fold changes on simple and complex genomes to identify interesting regions, then drill down to view detailed statistical results and tracks.

Chromosome plot

JMP Genomics 5 offers enhanced flexibility for movement of dendrograms and labels in cluster heat plots.

Cluster heat plots

Significant enhancements to copy number partitioning let users display segment means, shade segments relative to a referencevalue, and filter results to display segmentsthat meet a pre-specified cutoff.

Copy number partitioning

New segmentation summary plots can be filtered interactively to identify shared regions of copy number loss or gain.

Copy number segmentation

Overlay continuous variables such as p-values, intensities, counts or fold changes on simple and complex genomes, with the option to display single chromosomes as circular. Identify interesting regions, then drill down to view detailed results and tracks.

Display singular chromosomes as singular

Examine individual variations in copy number (left and upper right) or guide your search for shared regions with summary plots (lower right).

Examine copy number variations

Create, compress, and incorporate genetic distance matrices into association tests that simultaneously correct for relatedness and population structure. Distance matrices may also be created to display relationships between continuous measures, or custom distance matrices clustered and visualized.

Genetic distance matrices

Analyze mRNA-seq data to find interesting patterns of differential expression with interactive volcano plot.

Interactive volcano plot

The customizable JMP Genomics Starter window, new in version 5, makes it easy for new and existing users to access tools appropriate to their analysis areas.

JMP Genomics Starter window

Scale count data across samples using TMM normalization, compare TMM factors between samples, and view kernel density plots of normalized data.

Kernel Density MA Plot by Sample after TMM Normalization

Visualize linkage maps created in JMP Genomics or imported from other software.

Linkage Maps

View p-values from statistical tests individually by chromosome, or create custom, multichromosome views.

Manhattan plot

Identify genomic regions that contain marker genotypes shared identical by state between related or unrelated individuals.

Overlay Plot

View ROC curves and assess your predictive models using a variety of ROC statistics.

ROC Curves

Screen for SNP pair interactions using flexible filters, and drill down to view plots that display the details of trait values and SNP genotypes.

Screen for SNP pair interactions

Display summaries of your statistical analyses in genome context to identify interesting regions with pre-built settings for commonly used genomes, or by creating custom genome views. Then drill down to overlay gene, histogram, SNP and heat plot tracks on statistical results. Here, p-values across a genomic region are overlaid with co-localized genes and a histogram track that summarizes raw exon-level data for two samples of particular interest.

Summarize statistical analyses in genome context

Interactive triangular plots let you calculate and visualize linkage disequilibrium measures, identify LD blocks and zoom into interesting regions.

Triangular plots

See batch effects in your data and remove them prior to statistical analysis.

Visualize batch effects

Visualize shared patterns with multiway Venn diagrams. Overlay statistical findingsand annotation categories to drill down on the most important gene sets.

Visualize shared patterns with multiway Venn diagrams

Examine a summary volcano plot to identify pathways that are over- or under-represented in your significant gene list, using a variety of enrichment tests.

Volcano plot to visualize Analysis of Variance

Create bar charts and other graphs for multiple X or Y variables.

Bar charts for two variables

A box plot and bar chart shown in edit mode. Multiple graphs can be displayed at the same time.

Box plots and side-by-side bar charts

High-quality map regions are built into the app for visualizing geographic data.

Built in maps

Create outlier box plots, or select another box plot style.

Comparative box plots

Display contour plots and violin plots using the contour icon.

Contour plots (violin plot)

Customize the look and feel of your graphs. Change graph properties, colors, line widths, marker sizes and more.Display contour plots and violin plots using the contour icon.

Customize graphs

Focus on specific parts of the data in your graph using a data filter.

Data filter

Variables can be dragged and dropped to any of the drop zones to change parameters of the graph.

Drag and drop variables

Fit a regression line, and add confidence intervals and prediction intervals.

Fitted line with confidence and prediction intervals

Explore regression lines for categories of a grouping variable.

Fitted line with grouping variable

Drag one variable to the X or Y zone and use the histogram icon to create a histogram.

Histogram with one variable

Add a Group X or Group Y variable to create separate graphs. Add a variety of available summary statistics.

Histograms with summary statistics

Import JMP data tables from iTunes or Dropbox, or any website, or open JMP data from an e-mail attachment.

Import JMP data

View the JMP data table.

JMP data table

Create line graphs (run charts) for multiple overlaid variables.

Line graph (run chart)

Fit a number of functions to data including linear, quadratic and cubic fits.

Linear, quadratic, and cubic fits

Graph builder includes online samples and resources to help you get started quickly.

Online samples and help screen

Add summary statistics to your graphs.

Outlier box plot and summary statistics

Build multivariate scatterplots to visualize correlations between variables.

Scatterplots and contours

Share your results with others.

Share results

Fit a smoothing spline to data to explore the relationship between two variables.

Smoothing splines

Build stacked bar charts, or a variety of other bar chart styles, with or without summary statistics.

Stacked bar chart

Zoom into the values of individual points using the magnifier by tapping and holding the screen.

Tap and hold to zoom

Use the Wrap zone to display graphs when there are several categories of a grouping variable.

Trellis plots