-
- All Application Areas
- Academic
- Application Development
- Consumer and Market Research
- Culture of Analytic Excellence
- Dashboard Building
- Data Visualization and Exploratory Data Analysis
- Design of Experiments
- Life Sciences
- Quality Engineering, Reliability and Six Sigma
- Statistics, Predictive Modeling and Data Mining
-
 Achieving Product ReliabilityIn this chapter from the book Achieving Product Reliability, Bill Meeker, Necip Doganaksoy and Gerald Hahn introduce us to the role of statistics plays in reliability assurance.
-
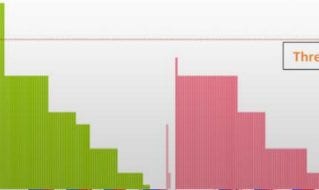
 Advantages of Bootstrap Forest for Yield AnalysisMaintain a high level of quality and control (in less time) with the bootstrap forest method. Here’s how!
-
 Art of StatisticsIn this introduction from his book, Art of Statistics, Sir David Spiegelhalter outlines why it's critically important to use statistical science to answer the kind of questions that arise when we want to better understand the world.
-
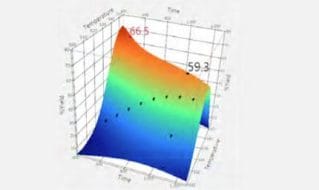
 Basics of Experimentation and Response Surface Methodology This book chapter explores the fundamentals of good experimentation. The authors' approach uses models to understand formulation systems and identify formulations that meet study objectives.
-
 Big Data, Pharma 4.0 and Process ModelingHow can you prepare for Industry 4.0? This paper outlines how to improve process knowledge, close the gaps for legacy products and set the foundation for big data use.
-
 Building Better Models with JMP ProDiscover the “what, why and how” of neural networks through case studies, figures and exercises. Examples demonstrate how models are used for both classification and prediction across an array of applications.
-
 Cautionary Tales in Designed ExperimentsThe beauty of DOE is about learning—from mistakes, from trying new things, and from working with others.. In this free e-book legendary author Dr. David Salsburg looks at the history of DOE and shares what to do (and what not to do) to successfully execute designed experiments.
-
 Choosing the Right Design - with an Assist from JMP's Design ExplorerDeciding what data to collect for an experiment is a critical decision that has substantial consequences. In this paper, you'll learn how JMP's Design Explorer gives data scientists an easy way to construct and contrast multiple experimental designs that can be compared and evaluated.
-
 Class of Three-Level Designs for Definitive Screening in the Presence of Second-Order EffectsIntroducing….a class of economical three-level designs for screening quantitative factors.
-
 Combinatorial Testing: An Approach to Systems and Software Testing Based on Covering ArraysThis chapter explores the testing approach known as combinatorial testing, using examples derived from real software systems.
-
 Dark DataIn Dark Data, Dr. Hand explores the many ways we can be blind to missing or unseen data and how, in our rush to be a data-driven society, we might be missing things that matter, leading to dangerous decisions that can sometimes have disastrous consequences.
-
 Data Exploration in Preparation for ModelingCase study: uncover the process a leading catalog retailer uses to prep data before building response models.
-
 Data Mining Techniques, Third EditionData Miners, Inc. co-founders explain how to create derived variables through a study on modeling customer attrition.
-
 Data Visualization and Model BuildingIn this paper, Richard De Veaux, Williams College, explains how visualization and data exploration can be used to draw conclusions about sports performance as we age.
-
 Definitive Screening Designs with Added Two-Level Categorical FactorsInventors of Definitive Screening designs share a new development in this reprint from the Journal of Quality Technology.
-
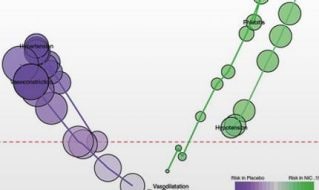
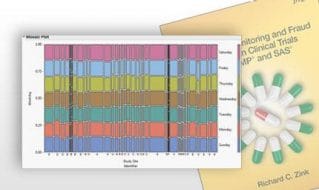 Detecting Fraud at the Clinical SiteOrganizations find a better way to protect participants in clinical trials. Learn the graphical and statistical approaches being used to identify site- and patient-perpetrated fraud.
-
 Discovering Partial Least Squares with JMPSee how Partial Least Squares (PLS) is used to solve a drug development dilemma. You'll also learn how this flexible statistical technique can be used to models relationships--even those with noisy inputs and multiple outputs
-
 Effective Visualization Techniques for Data Discovery and AnalysisHow do you communicate highly technical data to a non-analytical audience? Find out how in this paper on best practices in data visualization.
-
 End of EverythingIn this chapter from her book End of Everything, Astrophysicist Katie Mack discusses her favorite topic – the end of the universe and our improving efforts to gather data about it (Astrophysically Speaking).
-
 Evaluating the Measurement Process: A Better Way to Do Repeatability & Reproducibility StudiesStatistician, author and quality expert Donald J. Wheeler, explains data collection strategy in the context of a basic EMP and gage R&D study.
-
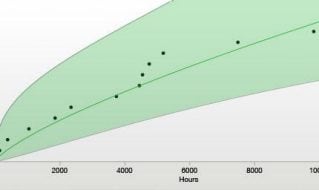 Explaining Reliability GrowthLearn about statistical techniques used to improve product and process reliability over time, and see specific examples using JMP software.
-
 Generating Adverse Event Narratives Using JMP ClinicalNew analytical process available to streamline the time-consuming task of creating patient narratives. Learn more about this function in JMP Clinical.
-
 How R&D Labs Can Learn More From Their Positive ControlsThe ultimate goal is to build models that predict a future that can be precisely reproduced by anyone,at any time So, how can two people get different results despite using the same equipment and protocols? Find out.
-
 How to Navigate the Top Seven Pitfalls of Data PrepWhile data cleanup has its obstacles, it is possible to reduce, or even eliminate, the impact of common challenges when preparing data for analysis.
-
 Improving Processes with Statistical ModelsHow, when and where do I apply statistical modeling to a problem? Find out in these two real-world case studies.
-
 Information Quality: The Potential of Data and Analytics to Generate KnowledgeNew case studies: find out how Information Quality was used as a guide to predict water quality and control a film deposition process.
-
 JMP and Analytics in BaseballIn this white paper, Sig Mejdal, Assistant GM of the Baltimore Orioles, discusses the proliferation of quants in the sport and explores how JMP has helped bring analytics to baseball.
-
 JMP for Mixed ModelsJMP for Mixed Models walks through, in example-driven fashion, the core concepts of mixed models and how best to apply them in practice.
-
 JMP Synergies: Using JMP and JMP Pro With Python and R There may be occasions where you'll want (or need) to use JMP in conjunction with open source tools. This paper will help you to get started using the Python and R connections in JMP.
-
 JMP takes the struggle out of data wranglingThis paper provides an introduction to the unglamorous, time-consuming, laborious, and sometimes dreaded “dirty work” of statistical investigations – data preparation. The good news: JMP can perform these operations with ease.
-
 Measurement Systems Analysis for Curve DataJMP Pro does an impressive job quickly and simply solving Measurement Systems Analysis with curve data, a complex and relevant problem.
-
 Moving from Minitab to JMP: A Transition Guide, Version 2This guide explains how Minitab and JMP differ in the handling of descriptive statistics and visualizations. It is meant to ease the user’s transition from Minitab v19 to JMP 16 and JMP Pro 16. Focus is on the user interface, how tools are accessed, how analyses are performed, and the general workflow of the packages.
-
 Moving From Minitab to JMP: A Transition GuideA practitioner's review of JMP vs. Minitab: unearth two different approaches to common statistical techniques and principles.
-
 Moving from SPSS to JMP: A Transition GuideThis guide explains how SPSS and JMP differ in the handling of descriptive statistics and visualizations. It is meant to ease the user’s transition from SPSS Version 27 to JMP 16 and JMP Pro 16.
-
 Never Stop LearningIn this chapter from Bradley Staats book, Never Stop Learning, you'll learn strategies for overcoming an inward focus, building relationships, and how best to learn from, and teach, others.
-
 On 100 Years of the Shewhart Control ChartIn this paper, William H. Woodall commemorates the 100th anniversary of the control chart with some ideas on how to make fuller use of them. Readers will also receive practical advice on how one might achieve the best results implementing statistical process monitoring.
-
 Optimal Design of Experiments: A Case Study ApproachWhat is a blocked experiment? When is one used and how is it constructed? Find out in this case study.
-
 Optimizing Pharmaceutical Production Processes Using Quality by Design MethodsGood news! Did you know that your quality by design goals can be derived in a straightforward way, the results can be easy to verify and that this method allows for further improvement of the processes without the need for re-registration? Find out more with this case study from pharma.
-
 Optimizing Processes with Design of ExperimentsWhat is design of experiments (DOE), and how does it deliver value? Through a case study approach, this white paper answers these questions and more.
-
 Pharmaceutical Quality by Design Using JMPLearn how QbD and good data visualization is used in early stage product development to help pharma organizations create more effective quality controls.
-
 Predictive Analytics Via Text MiningDownload a complimentary chapter about text mining for predictive analytics.
-
 Problem Solving for New Engineers: What Every Engineering Manager Wants You to KnowDownload a complimentary chapter about the strategy and tools needed to solve problems through experimentation.
-
 Regression and Analysis of VarianceIn this chapter excerpt from Peter Goos and Ellen Vandervieren's book Regression and Analysis of Variance, you'll learn about the use of multiple quantitative explanatory variables in JMP.
-
 Six ways to make charts more obviousThere are a variety of ways that we can make our charts more obvious to audiences. In this except Nick Desbarats outlines six such ways.
-
 Smart Machine Learning for ManufacturersThis paper introduces the 'smart machine learning' framework which unites the need to understand both the unique aspects of the data that is collected and the perspective of the data scientists who oversee its collection.
-
 Split-Plot Designs: What, Why, and HowLearn how to design and analyze split-plot experiments and why split-plot designs are often cheaper and more efficient than other methods.
-
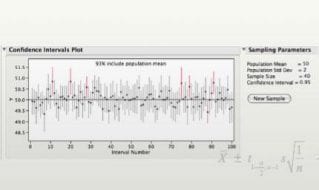 Statistical Intervals: Confidence, Prediction, EnclosureThis paper uses a manufacturing example to describe the differences between confidence, prediction and tolerance intervals.
-
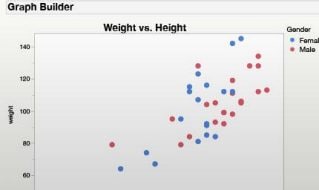
 Statistics with JMP: Graphs, Descriptive Statistics and ProbabilityNeed a better understanding of basic statistical theory and its applications? Let Professors Peter Goos and David Meintrup be your guide! An overview of descriptive statistics for nominal, ordinal and quantitative data, with particular attention to graphical representations is provided.
-
 Statistics with JMP: Hypothesis Tests, ANOVA and RegressionAnother great instruction guide by Professors Peter Goos and David Meintrup! This chapter specifically covers discrete and continuous random variables, with a focus on bivariate probability distributions and densities.
-
 Survey Data Analysis: The FundamentalsNew case study demonstrates best practices for survey analysis in JMP (including tips for dealing with missing data).
-
 Tap Into Unstructured DataThis white paper discusses ways to explore, analyze and use insights from unstructured text data.
-
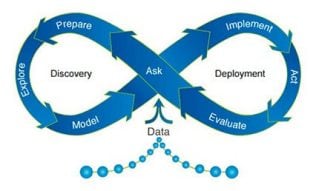
 The Analytics Lifecycle ToolkitDownload a complimentary chapter from The Analytics Lifecycle Toolkit, which provides a framework for the effective use of analytics at your organization.
-
 The CatalystIn Catalyst, Wharton Professor and author Jonah Berger explores change and its impact on human behavior. Taken from the introduction, this excerpt discusses how we can discover the hidden barriers preventing change and learn how to mitigate them.
-
 The Improbability PrincipleDownload a complimentary chapter from David Hand's well-known book, The Improbability Principle: Why Coincidences, Miracles, and Rare Events Happen Every Day.
-
 The Integration of Big Data Analytics into a More Holistic ApproachThis paper explores the fundamentals of big data analysis, showing how big data applications can be better integrated to achieve a more streamlined, holistic outcome.
-
 The JMP Design of Experiments AdvantageThis paper details the state-of-the-art DOE capabilities offered by JMP to help you tailor designs to your specific problem and resource limitations.
-
 The Why and How of Asking Good QuestionsChristine Anderson-Cook discusses how and why asking good questions helps shape curiosity and makes you a better collaborator.
-
 The Top 7 Myths That Lead to Really Bad GraphsIn this brief, we review seven of the most common misconceptions when visualizing data. When these myths are dispelled, your charts will be more effective and easier to design.
-
 Visual Six Sigma: Making Data Analysis LeanThis paper introduces the idea of "Visual Six Sigma," a practical, pragmatic and yes, visual approach to data analysis and process improvement.
-
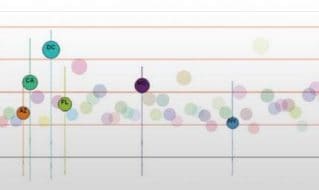
 Visualizing Change: An Innovation in Time-Series AnalysisData in motion: how good interactive graphs illustrate the shape, velocity and direction of change.
 Six Footprints for Leading Analytical ChangeIn this white paper, Tom Lange, retired Director of R&D at Procter & Gamble, passes on ideas, trends and best practices he's learned during a 40-plus year career building and leading analytical teams.