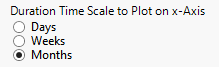
Duration Time Scale to Plot on x-Axis
Select the time unit scale to plot on the X-axis for the swimmer plot for the duration of response evaluation.
Available time metrics are listed in the following table:
|
Time Metric |
Function |
||||||
|
Days |
|
||||||
|
Weeks |
|
||||||
|
Months |
|
To Specify the Time Scale:
| 8 | Click the appropriate radio button. |