Stack
Use this widget to distinguish different levels within each of the adverse events summarized by the bars in the plots.
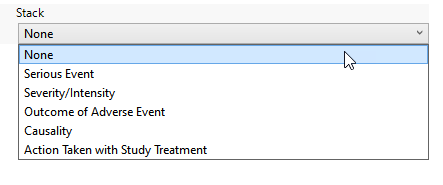
Available options are listed in the following table:
|
Option: |
Select when you want to: |
|
None |
Display all of the occurrences of each adverse events with no indications of levels within each class. |
|
Serious Event |
Display each adverse event bar in two colors - one representing serious events, the other color representing non-serious events. |
|
Severity/Intensity |
Display each adverse event bar in three colors - one representing mild events, the second color representing severe events, and the third color representing moderate events. |
|
Outcome of the Adverse Event |
Display each adverse event bar in six colors. Colors represent the following: Recovered/Resolved, Recovered/Resolved with Sequelae, Recovering/Resolving, Not Recovering/Not Resolved, Fatal, and Unknown. |
|
Causality |
Display each adverse event bar in four colors. Colors represent the following: not related to the treatment, unlikely related to the treatment, possibly related to the treatment, and related to the treatment |
| Action Taken with Study Treatment | Display each adverse event bar in fivecolors. Colors represent the following: Dose Not Changed, Not Applicable, Unknown, Dose Modified, and Drug Withdrawn. |
To Specify Whether to Stack Adverse Events:
| 8 | Make a selection using the drop-down menu. |