Findings Mean Change from Baseline Tables
This report lists the number (and percentage) of patients in each treatment arm at each visit that had a specified test. It then calculates the mean change from baseline for all patients in each group.
Note: JMP Clinical uses a special protocol for data including non-unique Findings test names. Refer toHow does JMP Clinical handle non-unique Findings test names? for more information.
Report Results Description
Running Findings Mean Change from Baseline Tables for Nicardipine using default settings generates the report shown below.
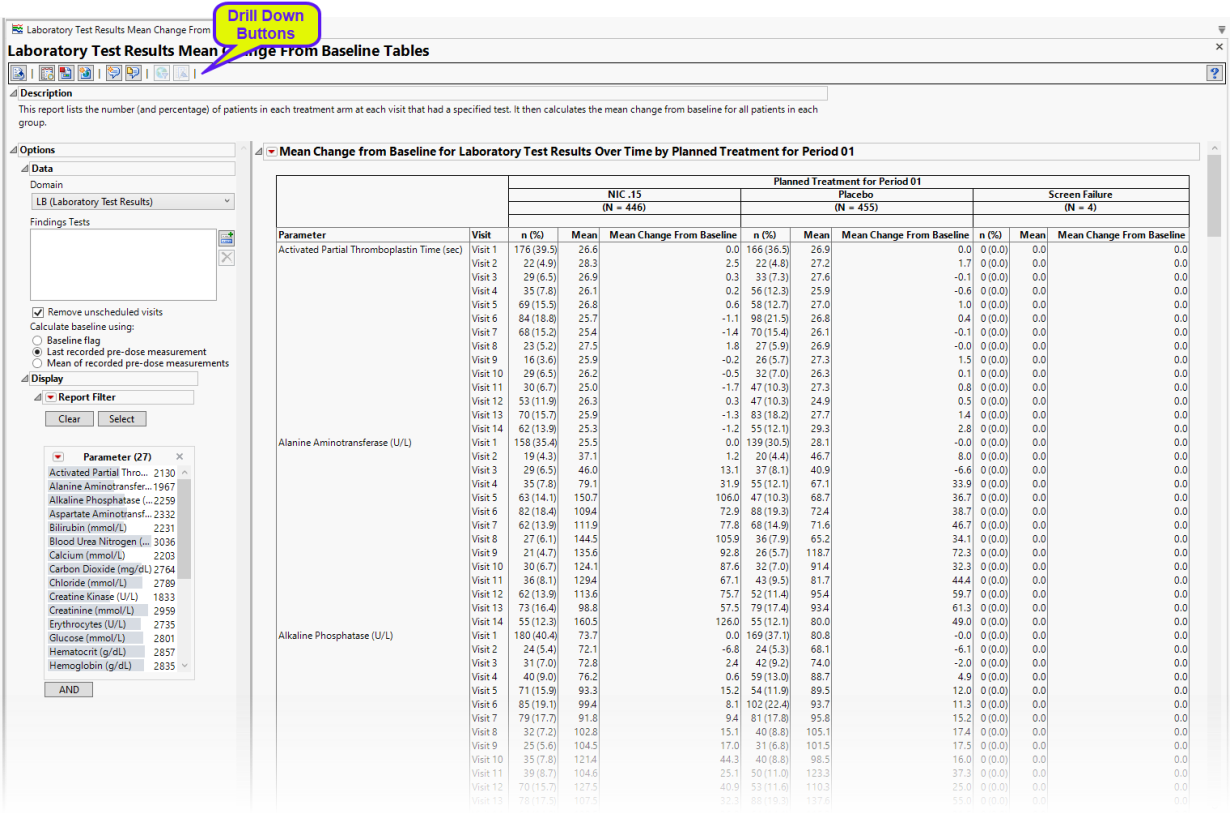
It contains the following elements:
• One table listing the number (percentage) of subjects in each arm that had a post-baseline record at each visit. The mean represents the mean change from baseline for that findings results among the patients who had a record.
Options
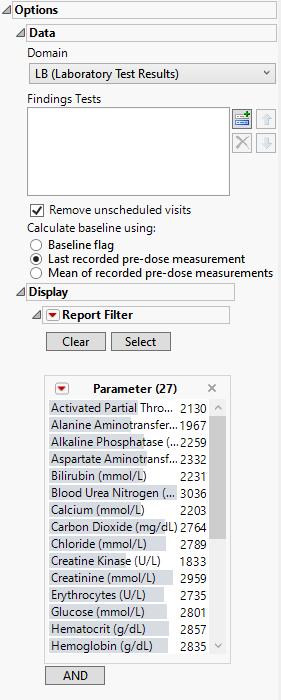
Domain
Use this widget to specify whether to plot the distribution of measurements from either the Electrocardiogram (EG), Laboratory (LB), or Vital Signs (VS) findings domains.
Findings Tests
Use this widget to select Findings Tests for the analysis. The report will autorun and analysis is restricted to the selected tests only.
Remove unscheduled visits
You might or might not want to include unscheduled visits when you are analyzing findings by visit. Check the Remove unscheduled visits to exclude unscheduled visits.
Calculate baseline as:
Use the Calculate baseline as: widget to use the last recorded pre-dose measurement or the mean of all the measurements taken during the baseline time window as the baseline measurement.
Report Filter
This widget enables you to subset and view subjects based on demographic characteristics and other criteria. By default, the filter in this report enables you to filter by findings tests. Refer to Data Filter for more information on filters.
General and Drill Down Buttons
Action buttons, provide you with an easy way to drill down into your data. The following action buttons are generated by this report:
| • | Click  to rerun the report using default settings. to rerun the report using default settings. |
| • | Click  to view the associated data tables. Refer to Show Tables/View Data for more information. to view the associated data tables. Refer to Show Tables/View Data for more information. |
| • | Click  to generate a standardized pdf- or rtf-formatted report containing the plots and charts of selected sections. to generate a standardized pdf- or rtf-formatted report containing the plots and charts of selected sections. |
| • | Click  to generate a JMP Live report. Refer to Create Live Report for more information. to generate a JMP Live report. Refer to Create Live Report for more information. |
| • | Click  to take notes, and store them in a central location. Refer to Add Notes for more information. to take notes, and store them in a central location. Refer to Add Notes for more information. |
| • | Click  to read user-generated notes. Refer to View Notes for more information. to read user-generated notes. Refer to View Notes for more information. |
| • | Click  to open and view the Review Subject Filter. to open and view the Review Subject Filter. |
| • | Click  to specify Derived Population Flags that enable you to divided the subject population into two distinct groups based on whether they meet very specific criteria. to specify Derived Population Flags that enable you to divided the subject population into two distinct groups based on whether they meet very specific criteria. |
Default Settings
Refer to Set Study Preferences for default Subject Level settings.
Methodology
No testing is performed. Analysis is restricted to calculating the mean difference for each findings test from its baseline value.