Findings Waterfall Plots
This report creates waterfall plots to show the distribution of changes in test measurements for a given Findings domain across subjects (ordered by their magnitude of change). The Findings measurements are summarized based on a specified summary statistic and a waterfall plot is created for each Findings test.
Note: JMP Clinical uses a special protocol for data including non-unique Findings test names. Refer to How does JMP Clinical handle non-unique Findings test names? for more information.
Report Results Description
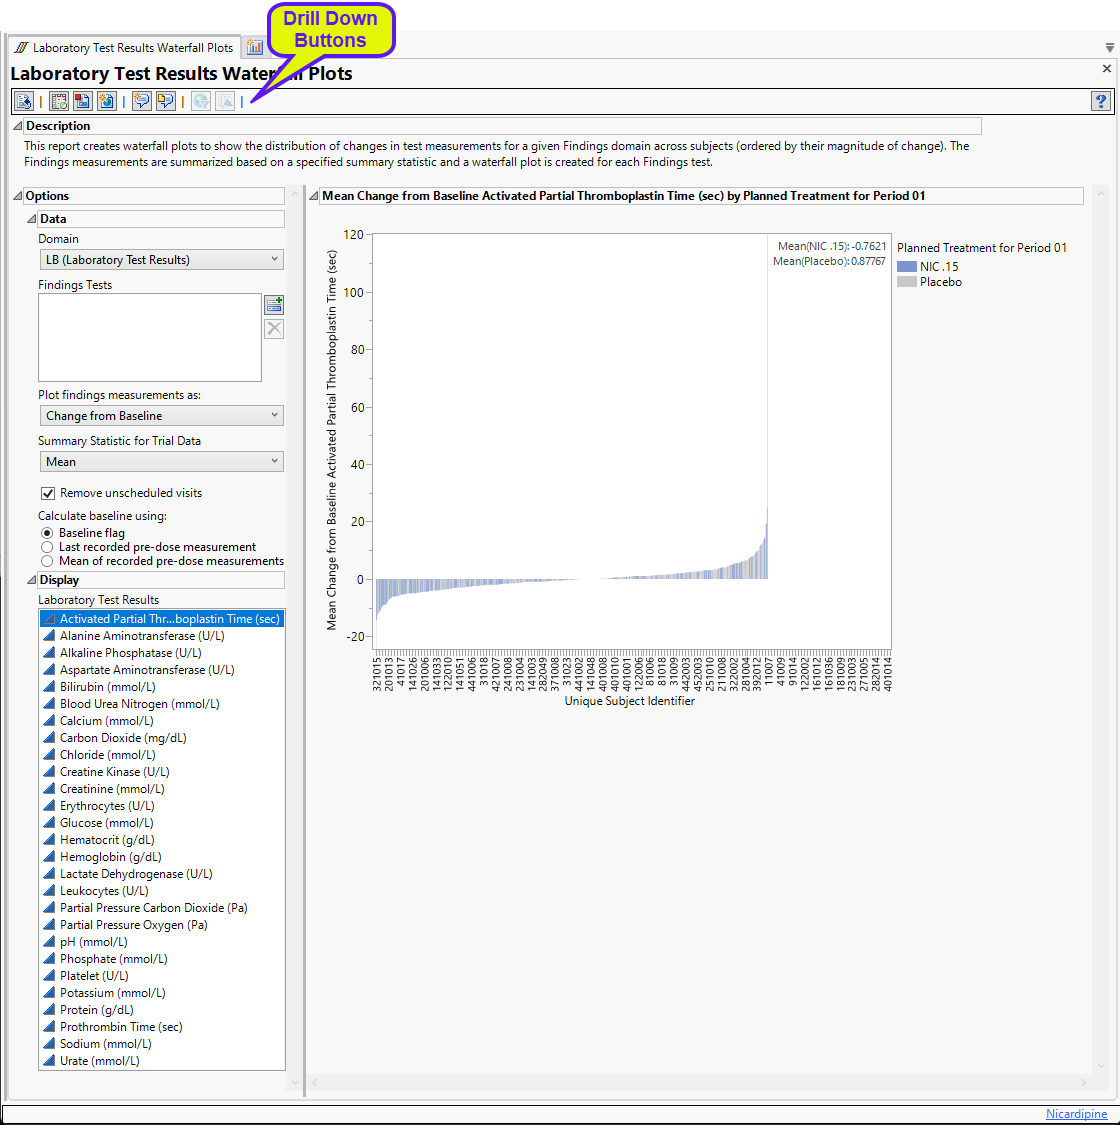
Running Findings Waterfall Plots with the Nicardipine sample setting and LB findings domain generates the report shown below.
Waterfall Plots
There is one Waterfall Plot for each quantitative findings test (for example, laboratory tests) in the Findings data set that was analyzed. Output data set is a stacked data set of findings measurements at subject level; subject level drill downs available.
Use the filter at left to select the finding plot to view. Each plot shows a summary of the findings test measurements on the Y axis for each subject (on X axis) ordered by that measurement. Caption boxes in the upper right corner of each graph (optional) display a summary statistic across all subjects (in a treatment or BY variable group) to aid in understanding the differences in the center/spread of the group distributions.
Options
Data
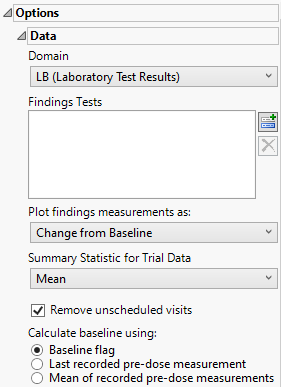
Domain
Use this widget to specify whether to plot the distribution of measurements from either the Electrocardiogram (EG), Laboratory (LB), or Vital Signs (VS) findings domains.
Findings Tests
Use this widget to select specific Findings tests.
| 8 | Click  to open the Add window (shown below) that lists available test names (shown below). to open the Add window (shown below) that lists available test names (shown below). |
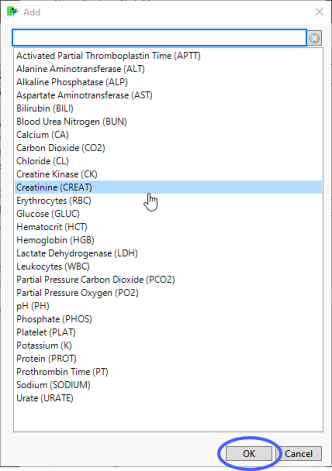
| 8 | Select the desired test(s) and click to add them to the text box. |
Plot findings measurements as:
Use this widget to specify whether to plot the results either as observed or how they relate to the baseline measurement. Refer to Plot findings measurements as: for more information.
Summary Statistic for Trial Data
Use the Summary Statistic for Trial Data widgetto specify whether to display the mean, median, maximum, minimum, or last values to summarize the results of the trial period.
Remove unscheduled visits
You might or might not want to include unscheduled visits when you are analyzing findings by visit. Check the Remove unscheduled visits to exclude unscheduled visits.
Calculate baseline as:
Use the Calculate baseline as: widget to use the last recorded pre-dose measurement or the mean of all the measurements taken during the baseline time window as the baseline measurement.
Display

Use this widget to select the findings results to display in the plot.
General and Drill Down Buttons
Action buttons, provide you with an easy way to drill down into your data. The following action buttons are generated by this report:
| • | Click  to rerun the report using default settings. to rerun the report using default settings. |
| • | Click  to view the associated data tables. Refer to Show Tables/View Data for more information. to view the associated data tables. Refer to Show Tables/View Data for more information. |
| • | Click  to generate a standardized pdf- or rtf-formatted report containing the plots and charts of selected sections. to generate a standardized pdf- or rtf-formatted report containing the plots and charts of selected sections. |
| • | Click  to generate a JMP Live report. Refer to Create Live Report for more information. to generate a JMP Live report. Refer to Create Live Report for more information. |
| • | Click  to take notes, and store them in a central location. Refer to Add Notes for more information. to take notes, and store them in a central location. Refer to Add Notes for more information. |
| • | Click  to read user-generated notes. Refer to View Notes for more information. to read user-generated notes. Refer to View Notes for more information. |
| • | Click  to open and view the Review Subject Filter. to open and view the Review Subject Filter. |
| • | Click  to specify Derived Population Flags that enable you to divided the subject population into two distinct groups based on whether they meet very specific criteria. to specify Derived Population Flags that enable you to divided the subject population into two distinct groups based on whether they meet very specific criteria. |
Default Settings
Refer to Set Study Preferences for default Subject Level settings.
Methodology
No testing is performed. Analysis is restricted to calculating simple statistics of findings results.