Multivariate Outliers
This report uses the K Nearent Neighbors and Robust PCA methods in the JMP Explore Outliers platform to identify outliers in multivariate space. Exploring and understanding outliers in your data is an important part of analysis. Outliers in data can result from mistakes in data collection or reporting, measurement systems failure, the inclusion of wrong or missing value codes in the data set, or simply an unusual value. The presence of outliers can distort estimates and bias results toward those outliers.
This report attempts to use as much data as possible and takes all findings test codes by visit number for each subject. Of course, doing so can lead to missing data particularly for studies that do not appear to have a fixed number of visits or with lots of dropouts. Because outlier distance cannot be calculated with lots of missing data present, variables with more than 5% missing values are not considered. Of remaining variables, scores are computed for those subjects with complete data.
Report Results Description
For the Nicardipine example shown here, 12 out of 510 variables from the LB, EG, VS domains have missing data rates below 5% and are kept. This information is described at the top of the output.
Running this report for Nicardipine using default settings generates the Report shown below.
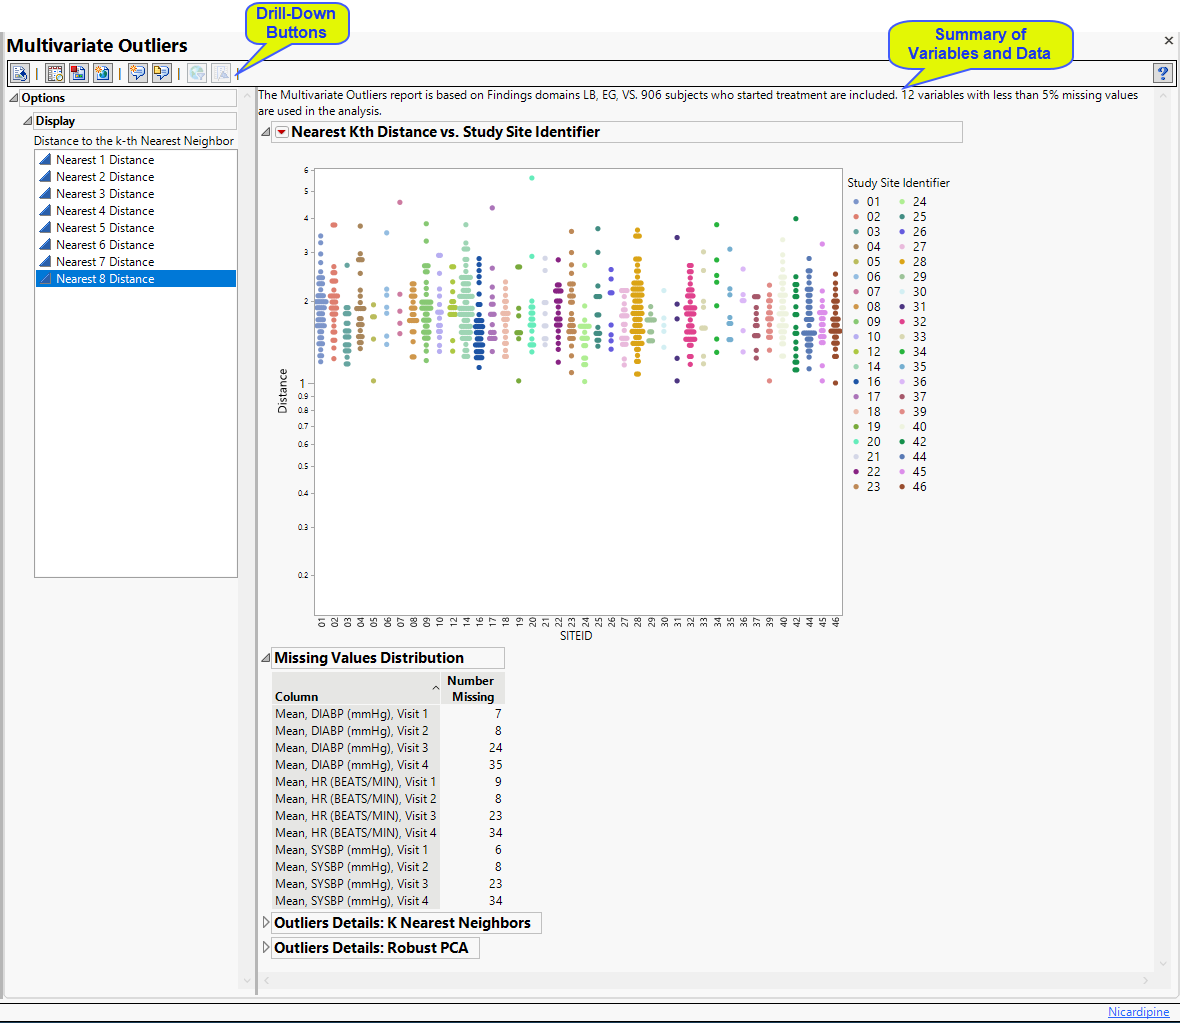
The report initially shows four sections.
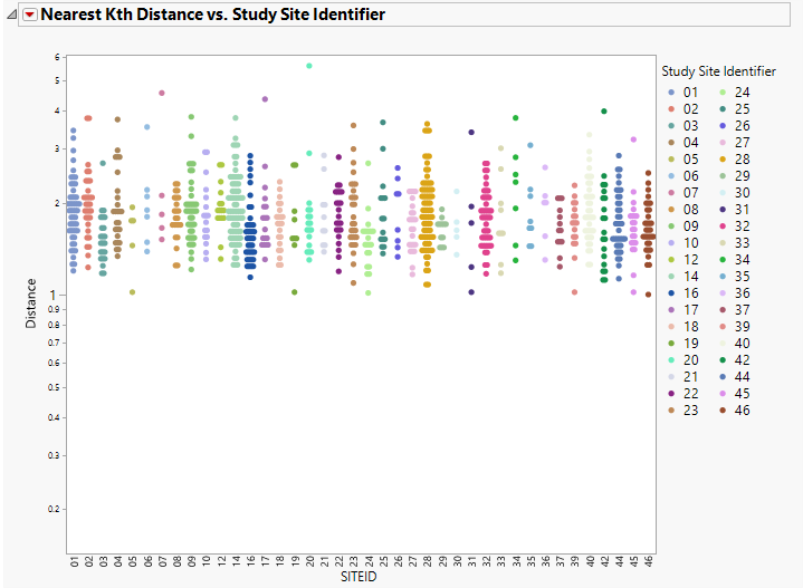
Nearest Kth Distance by Study Site
Presents plots of the Euclidean distance of a subject to its Kth nearest neighbor for all subjects, sorted and colored by study site.
This section contains the following elements:
| • | One plot to identify significant outliers. This plot shows the distance of each subject from their kth nearest neighbor. Users can change the Y axis variable from the "Nearest 1 Distance" up to "Nearest 8 Distance". For instance, if a subject has an extreme distance value to its nearest neighbor (Nearest 1), then this subject is very likely to be an outlier in the high-dimensional space. |
Distance is plotted on the log scale to allow for easier visualization of large distance ranges due to the presence of extreme values.
Missing Data Distribution Table
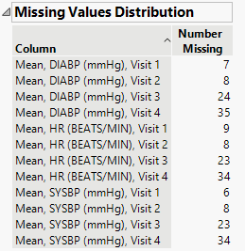
This table lists the columns analyzed for outliers and the number of missing values each contains.
Outlier Details: K Nearest Neighbors
The K Nearest Neighbor Outliers method is used to identify an outlier based on distance to its nearest neighbor. For each value of k, the K Nearest Neighbor Outliers method displays a plot of the Euclidean distance from each point to its kth nearest neighbor. Plots are provided for k = 1 through 8.
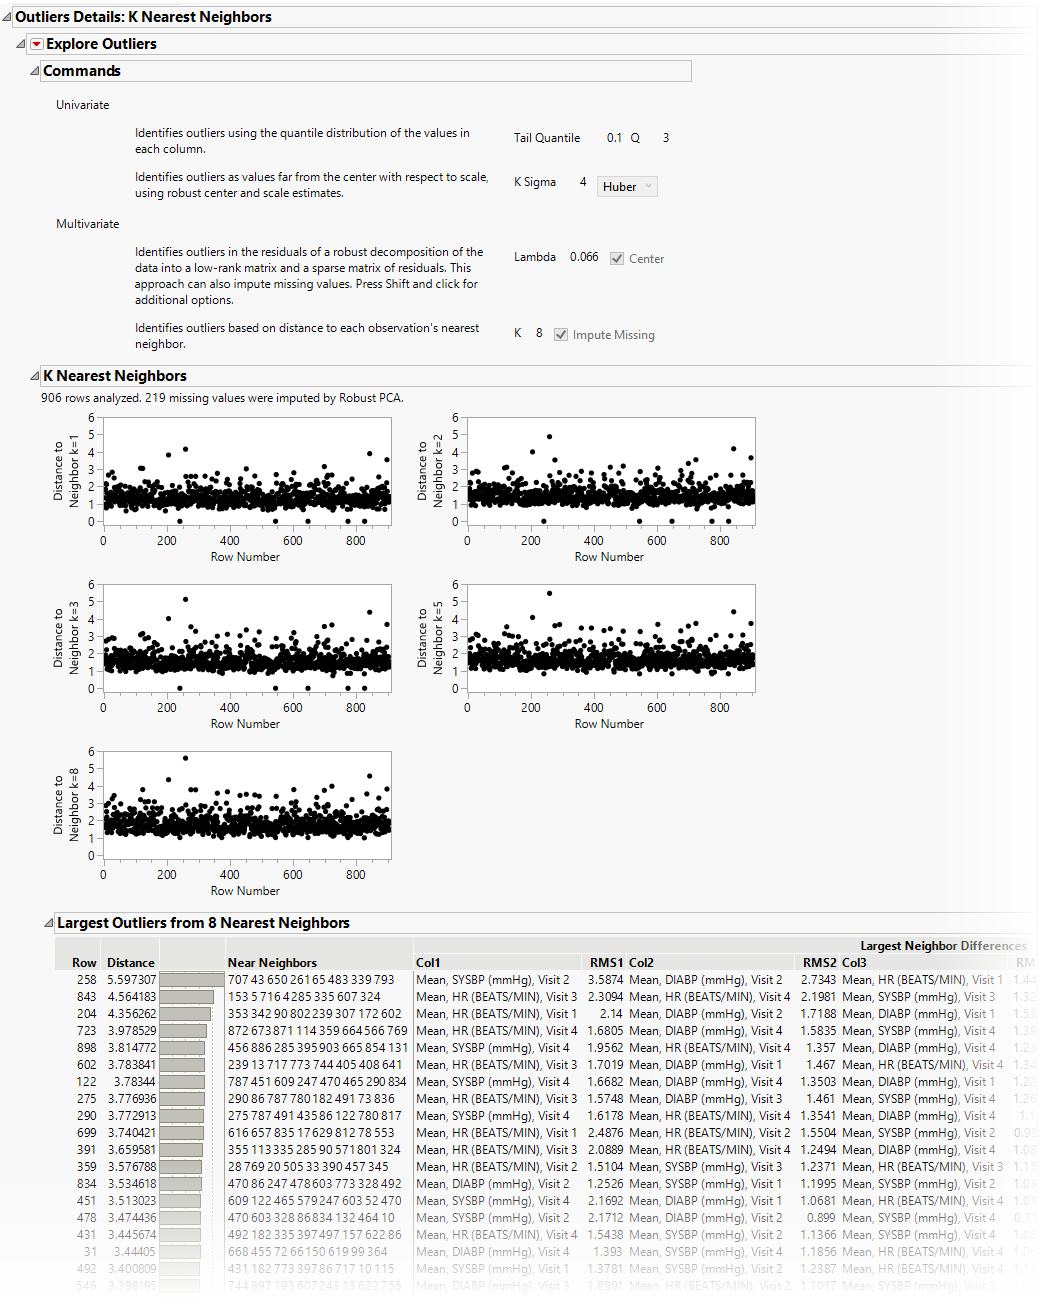
Plots
The plots display select values of k up to the value K. The value of k for each plot is displayed in its vertical axis label. It is of the form Distance to Neighbor k = <a>, where a is an integer denoting the ath closest neighbor. Each plot shows the distance from the point in the ith row to its ath nearest neighbor. The points that have large distances from their neighbors, across multiple values of k, are likely to be outliers.
Table
This table contains the 20 observations with the largest distances from their Kth nearest neighbor. Refer to the K Nearest Neighbors Report for details about the contents of this table.
Outliers Details: Robust PCA
The Robust PCA Outliers method performs a sequence of singular value decompositions and thresholding steps to decompose the data matrix. The data are decomposed into a low-rank matrix and a sparse matrix of residuals. The thresholding is done so that the residuals are either very large for outliers or very close to zero for non-outliers. The algorithm determines a matrix rank appropriate to capture the systematic variation without the outliers or small noise. Outliers that are not in the low-rank space are detected based on their residuals.
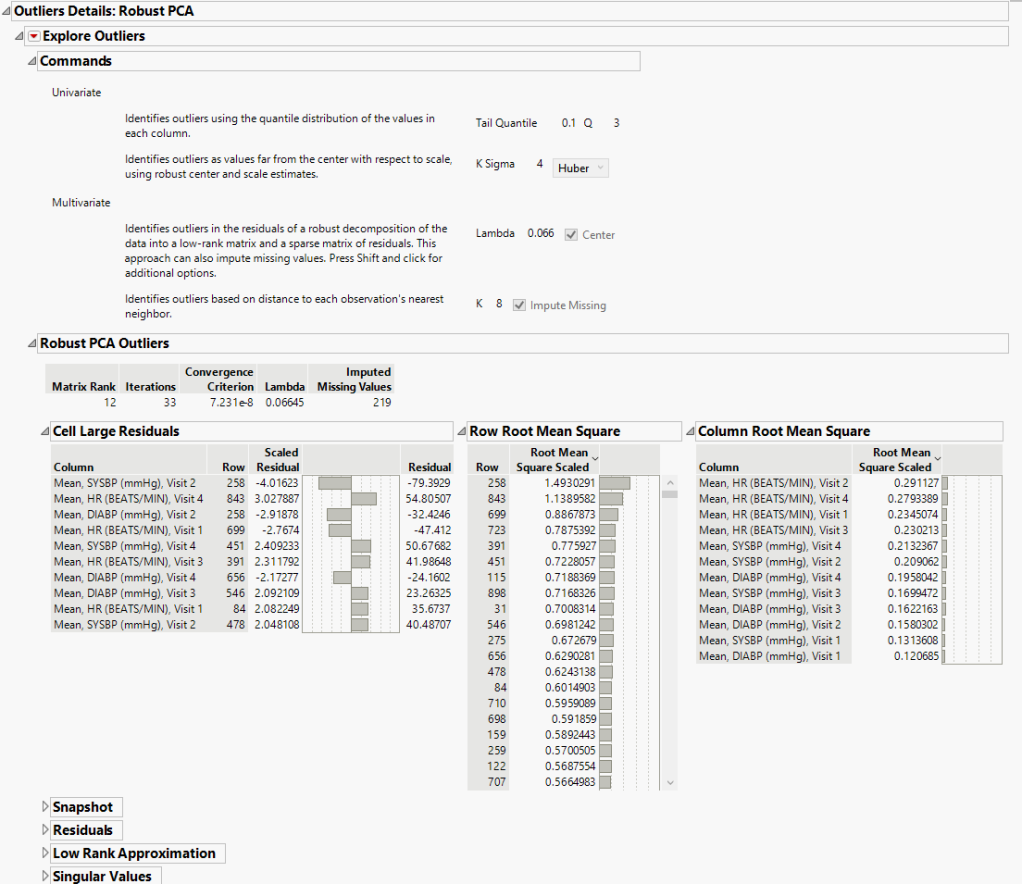
Cell Large Residuals
A table that shows the largest outlier observations, identified by column name and row number. The number of observations shown is determined by the Outlier Threshold. The table contains the column name and row number of the observation, the residual value, and the scaled residual value.
Snapshot
A graphical representation of the outlier cells in the data table.
Residuals
The matrix of residuals from the matrix decomposition.
Low Rank Approximation
The matrix of scaled residuals from the matrix decomposition.
Singular Values
The vector of singular values from the SVD.
Refer to Robust PCA Outliers Report for more information.
Options
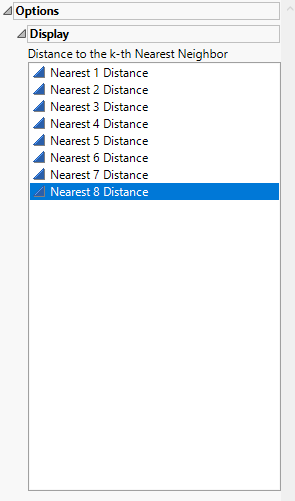
Display options enable you to view the distance of each observation to the specified kth nearest neighbor.
General and Drill Down Buttons
Action buttons, provide you with an easy way to drill down into your data. The following action buttons are generated by this report:
| • | Click  to rerun the report using default settings. to rerun the report using default settings. |
| • | Click  to view the associated data tables. Refer to Show Tables/View Data for more information. to view the associated data tables. Refer to Show Tables/View Data for more information. |
| • | Click  to generate a standardized pdf- or rtf-formatted report containing the plots and charts of selected sections. to generate a standardized pdf- or rtf-formatted report containing the plots and charts of selected sections. |
| • | Click  to generate a JMP Live report. Refer to Create Live Report for more information. to generate a JMP Live report. Refer to Create Live Report for more information. |
| • | Click  to take notes, and store them in a central location. Refer to Add Notes for more information. to take notes, and store them in a central location. Refer to Add Notes for more information. |
| • | Click  to read user-generated notes. Refer to View Notes for more information. to read user-generated notes. Refer to View Notes for more information. |
| • | Click  to open and view the Review Subject Filter. to open and view the Review Subject Filter. |
| • | Click  to specify Derived Population Flags that enable you to divided the subject population into two distinct groups based on whether they meet very specific criteria. to specify Derived Population Flags that enable you to divided the subject population into two distinct groups based on whether they meet very specific criteria. |
Default Settings
Refer to Set Study Preferences for default Subject Level settings.
Methodology
Scores for all findings tests are computed as described above.