Stack
Use this widget to distinguish different levels within each of the adverse events summarized by the bars in the plots.
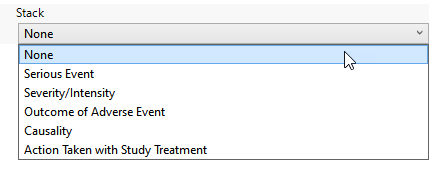
Available options are listed in the following table:
|
Option: |
Select when you want to: |
|
None |
Display all of the occurrences of each adverse events with no indications of levels within each class. |
|
Serious Event |
Display each adverse event bar in two colors - one representing serious events, the other color representing non-serious events. |
|
Severity/Intensity |
Display each adverse event bar in three colors - one representing mild events, the second color representing severe events, and the third color representing moderate events. |
|
Outcome of the Adverse Event |
Display each adverse event bar in six colors. Colors represent the following: Recovered/Resolved, Recovered/Resolved with Sequelae, Recovering/Resolving, Not Recovering/Not Resolved, Fatal, and Unknown. |
|
Causality |
Display each adverse event bar in four colors. Colors represent the following: not related to the treatment, unlikely related to the treatment, possibly related to the treatment, and related to the treatment |
| Action Taken with Study Treatment | Display each adverse event bar in fivecolors. Colors represent the following: Dose Not Changed, Not Applicable, Unknown, Dose Modified, and Drug Withdrawn. |
| Period |
This option is displayed only when multiple treatment periods have been detected and displayed. Pre-treatment is been assigned to period=0. Displayed counts indicate the number of subjects experiencing an event in each period. Note: This is selected by default when crossover data is detected. |
Note: The options available are dependent on the presence of the relevant variables in the data. For example, Severity is listed only when AESEV is present in the data tables.
To Specify Whether to Stack Adverse Events:
| 8 | Make a selection using the drop-down menu. |