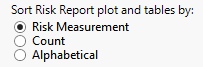
Sort Risk Report plot and tables by:
Use this option to specify how the rows in the Risk Report plot and tables are to be sorted.
This option applies to the Distribution table only (the graph is always sorted by count).
Choose Risk Measurement to sort the values in both the plots and tables in descending order of the risk measurement selected.
Choose Count to sort the risks in descending order for Count by Group Level (if a higher level is chosen) and then by count of Term Level within Group Level. When this option is selected, the column displaying relative risk differences is replaced by one displaying total counts.
Choose Alphabetical to sort the Group and Term values alphabetically. When this option is selected, the relative risk differences and total counts columns are not displayed.