Waterfall Plot
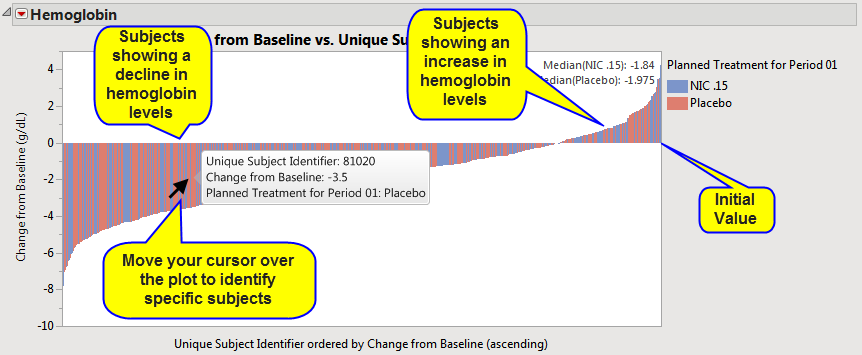
A Waterfall plot shows changes from baseline to a final value for each subject. Subjects are sorted by the magnitude of change, making it easy to visualize the direction and extent of change across the study population. Separate waterfall plots are generated for each findings test.
In the example below, the plot displays changes in hemoglobin levels for individual subjects treated with either Nicardipine or placebo. Each bar represents one subject. Decreases from baseline appear below the zero change line, and increases appear above the zero change line. In this example we observe more subjects having decrease from baseline than increases.
Interacting with the Waterfall Plot
|
8
|
Move your cursor over the plot to identify and view information for individual subjects. |
|
8
|
Click a bar to select a subject. |
|
8
|
To select multiple subjects, press and hold Ctrl while clicking additional bars. |
Interpretation
Use waterfall plots to:
|
•
|
Compare the magnitude of change across subjects. |
|
•
|
Identify subjects with the largest increases or decreases. |
|
•
|
Evaluate overall response patterns within and between treatment groups. |