UpSet Format
UpSet plots are used to communicate the frequency of subgroups produced according to one or more factors compared to the marginal frequencies of considering each factor alone.
This plot can be formatted in a number of different ways:
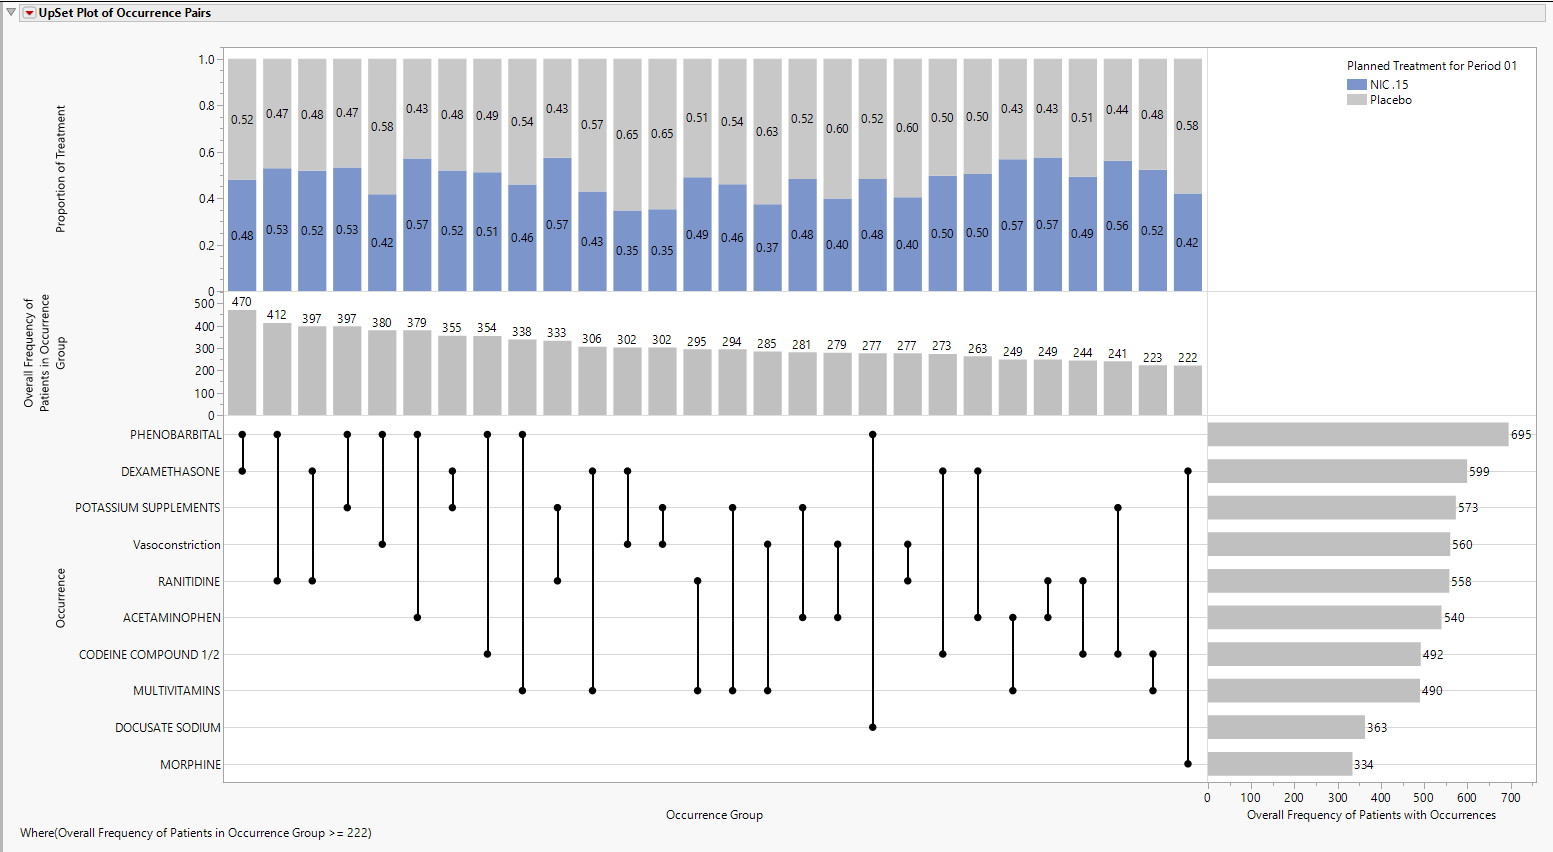
BarChart
The default view of the upper part of the UpSet plot is the stacked Bar Chart, shown above, summarizing the proportion of treatments. Choose Stacked Bar to produce this view.
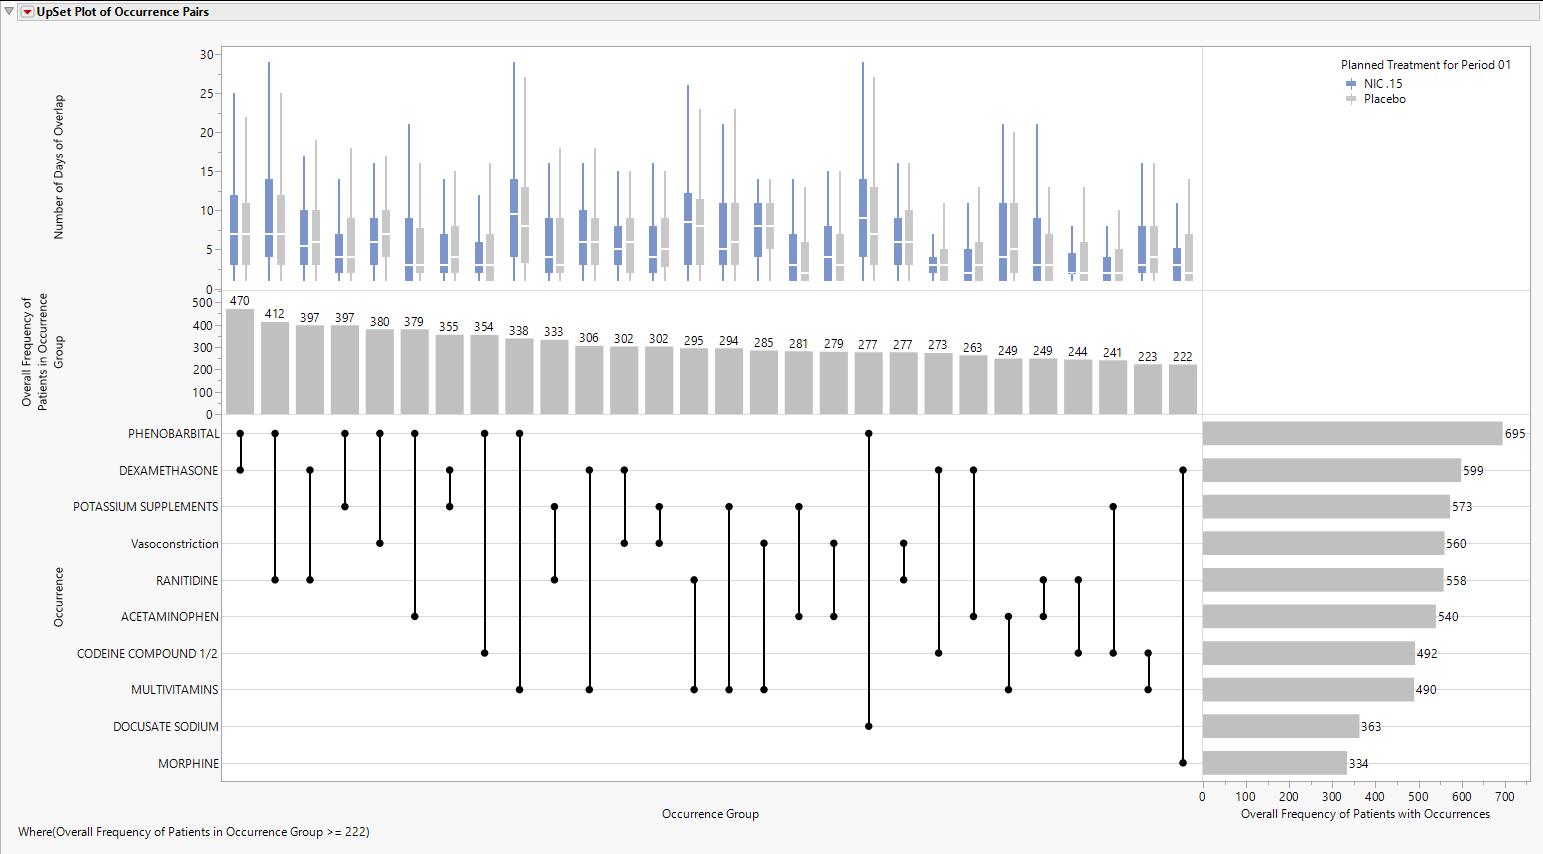
Box Plot
Choose Box Plot to produce side by side Box Plots, shown below, summarizing the Number of Days of Overlap for Occurrence Groups, shown below.
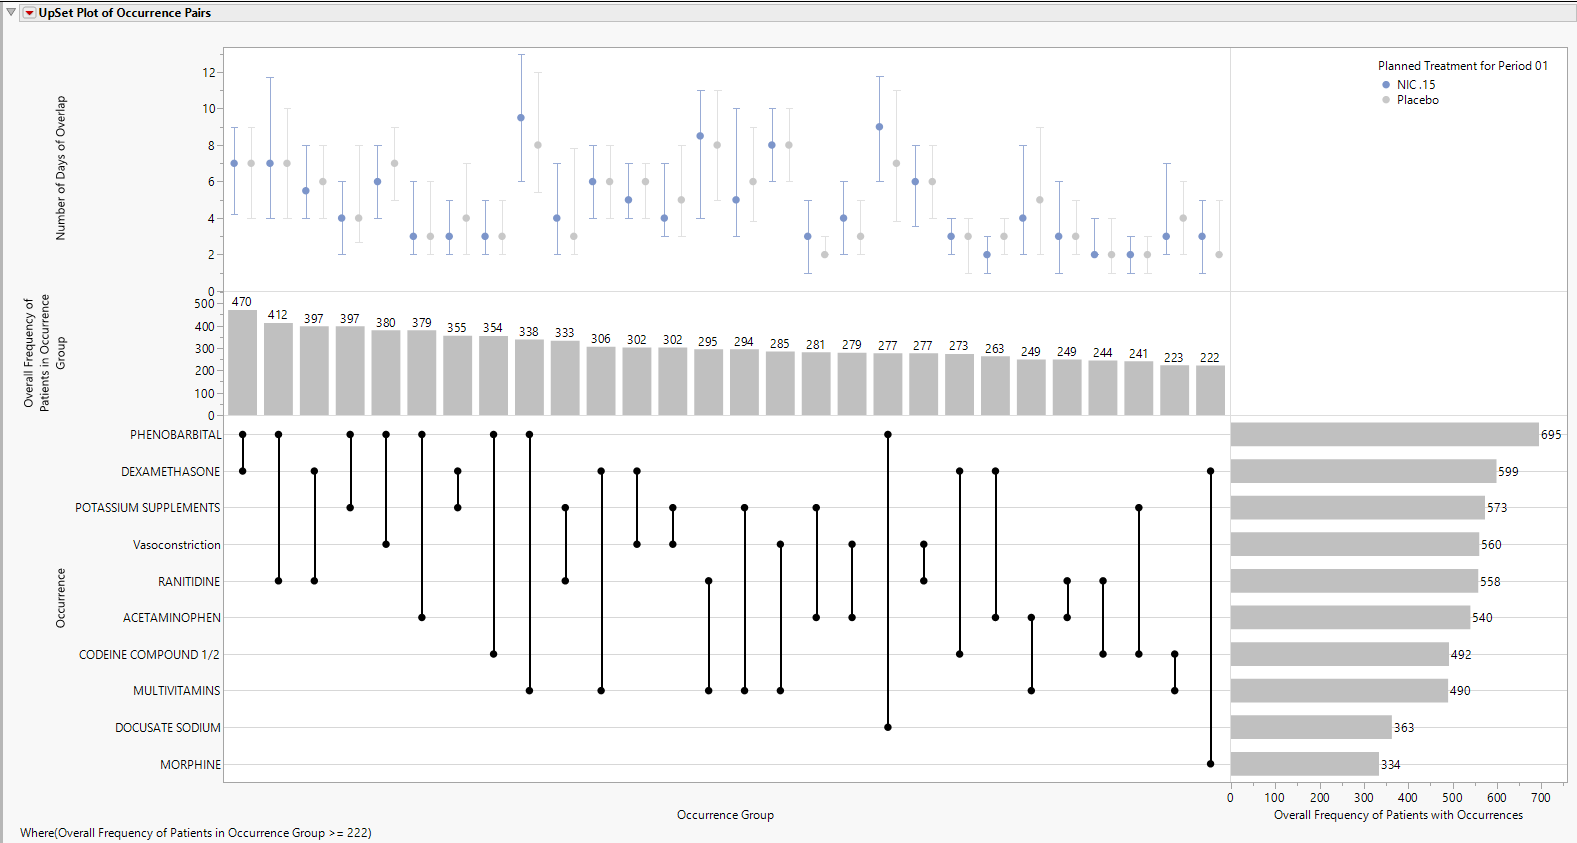
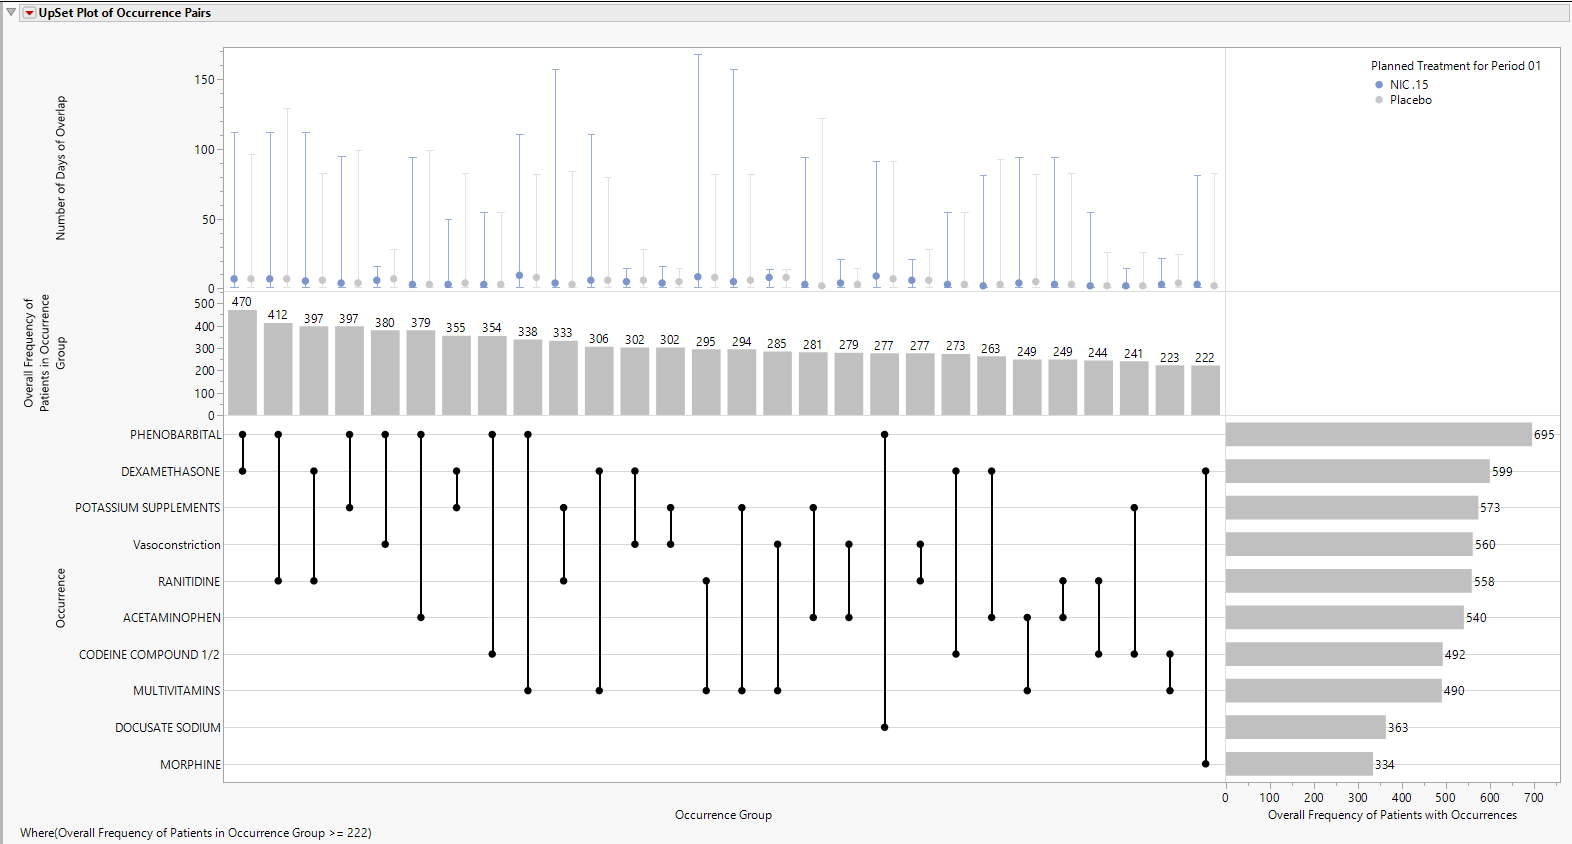
Range Bar
Choose Range Bar to produce a range bar plot, formatted to appear like a confidence interval, that summarizes the median value as a symbol with low and high interval values represented by the minimum and maximum observed values, respectively, shown below.
Choose Interquartile Range Bar to produce a range bar plot, formatted to appear like a confidence interval, that summarizes the median value as a symbol with low and high interval values represented by the first quartile and third quartile values, respectively, shown below.