Venn Diagram
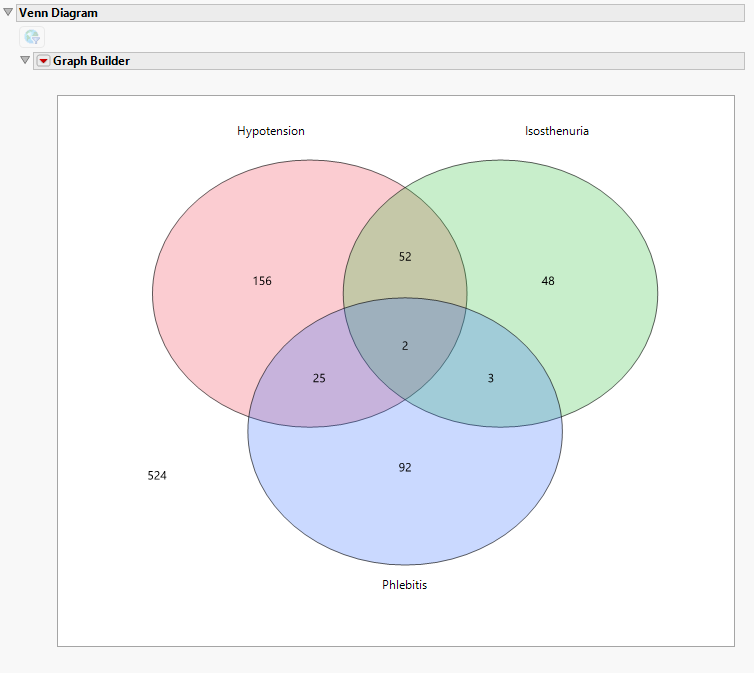
A Venn diagram displays overlapping circles, each representing a selected term or group, where the overlapping regions show subjects who experienced multiple events simultaneously. This allows you to quickly visualize the extent of co-occurrence across adverse events — identifying which combinations appear most frequently and how much overlap exists between individual terms or groups within the study population.