Progression Free Survival
Progression free survival is used to describe how long patients can go without the disease getting worse. This process uses a modified survival plot to compare the number and percentage of patients who have tumor progression or death, with patients who show no tumor progression or death at the cut-off date. Results are summarized in a set of tables.
Report Results Description
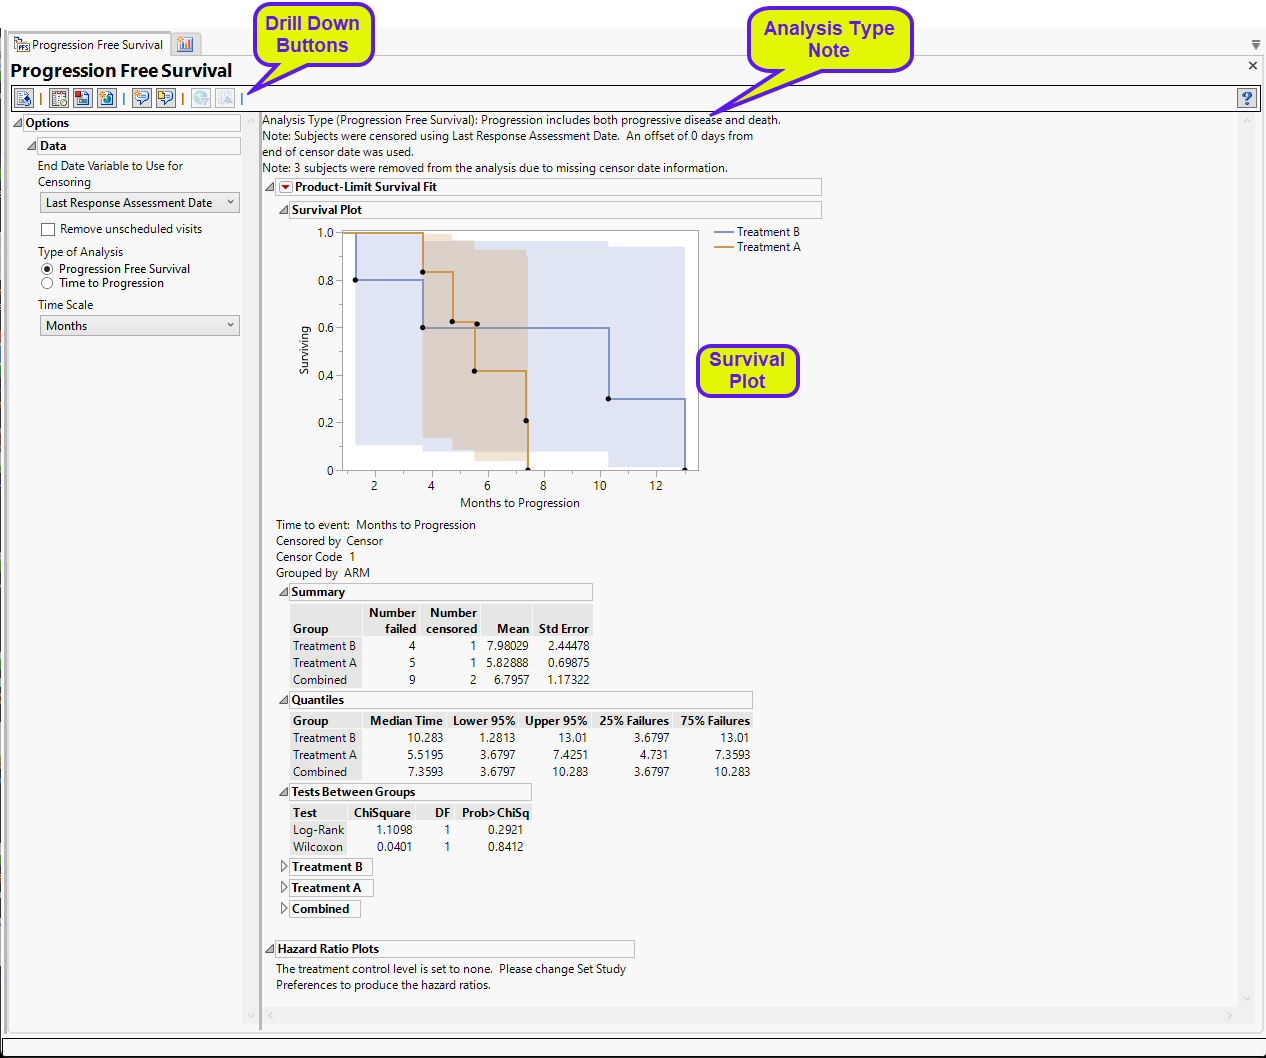
Running this report for a modified Nicardipine study using default settings generates the report shown below.
Progression Free Survival
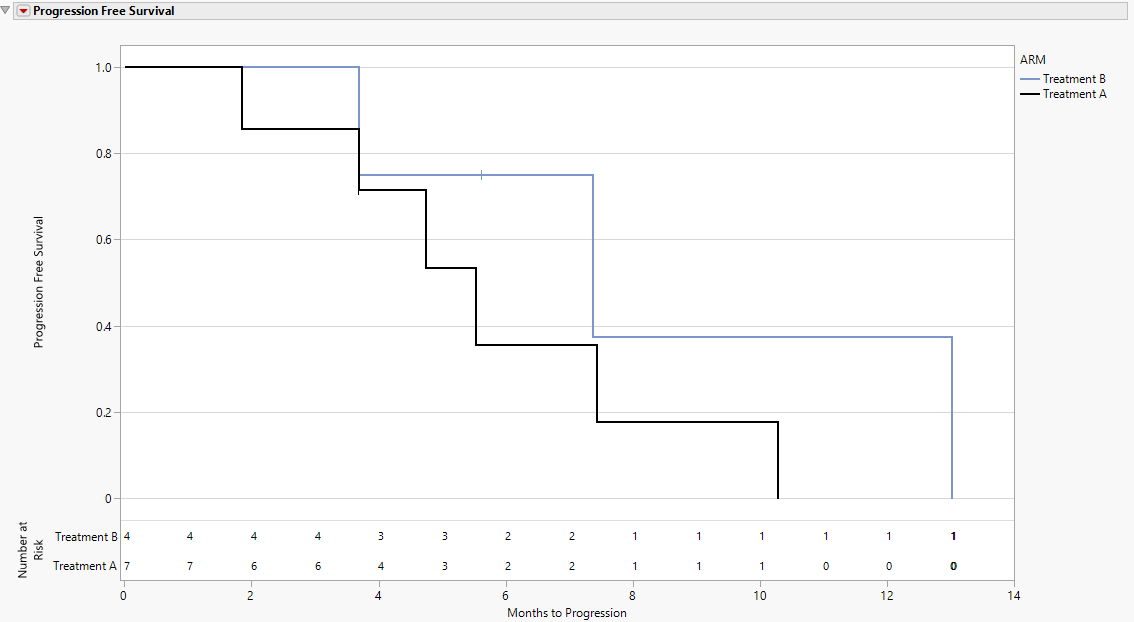
This plot shows the probability of patients showing no disease progression over the course of the study. The plateaus indicate that the probability of not progressing remains the same during that period. The dots indicate that patients have either shown disease progression or have left the study (withdrawal or death). The connecting lines are colored by treatment.
The Number at Risk table, displayed at the bottom of the figure when All Patients is selected using the Number at Risk display option, communicates the number of patients who have yet to have an event or be censored. When Cumulative Events is selected using the Number at Risk display option, the total number of patients with events up to and including a particular time are presented in the risk table, which has now been renamed Cumulative Events. Numbers are presented every 30 days and at the last day of follow up.
Product-Limit Survival Fit
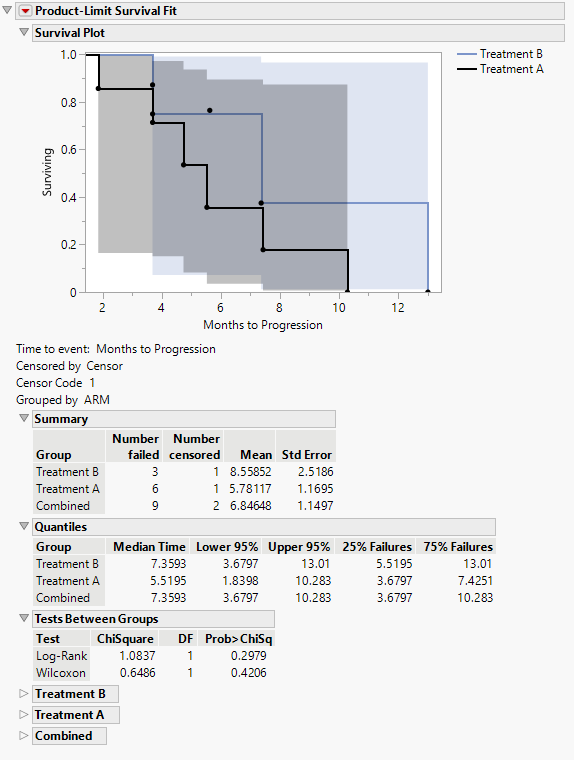
This plot shows the probability of patients showing no disease progression over the course of the study. The plateaus indicate that the probability of not progressing remains the same during that period. The dots indicate that patients have either shown disease progression or have left the study (withdrawal or death). The connecting lines are colored by treatment.
| • | Associated Summary tables |
The tables summarize the response and statistics of patients receiving the treatment or control.
Hazard Ratio Plots
The hazard ratio event plot displays the relative disadvantages between two different treatment regimes on the survival of subjects in a study.
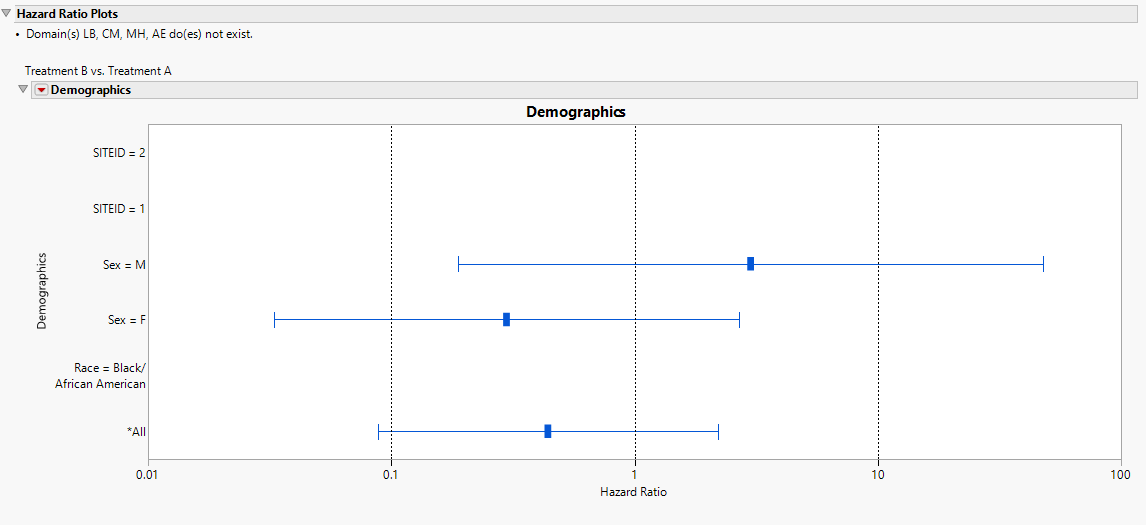
The Hazard Ratio Event Plots with 95% confidence intervals for each of the following demographic subgroups: overall, gender, and race. Additional groups can include country, study site identifier, high and low baseline lab tests, concomitant medications, medical history, and adverse events.
Options
Data
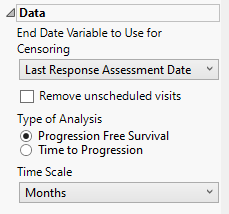
End Date Variable to Use for Censoring
For patients who survive progression-free beyond the end of the study, the ultimate progression-free survival values for these individuals are unknown. All that can be said is that progression-free survival exceeds the period of the study; these data are considered censored. For these cases, you must specify the end date for collecting data to assess progression. The End Date Variable to Use for Censoring option is used to select which variable date reference from the demography domain to use for calculating the censored disease progression values. Patients who progress after this date are not considered as progressing. The Last Response Assessment Date is chosen by default.
Remove unscheduled visits
Unscheduled visits can occur for a variety of reasons. By default, these are excluded from this analysis. However, by unchecking the Remove unscheduled visits box, you have the option of including them.
Type of Analysis
The Type of Analysis widget enables you to specify whether you want to measure Progression Free Survival or Time to Progression. Progression free survival measures the time from patient randomization to either tumor progression or death. Time to progression censors death and only considers time from randomization to objective tumor progression. A note is added to the top of the report indicating which type of analysis has been selected.
Time Scale
By default, time is measured in months. However, you can change the Time Scale to plot time in either months or weeks. This option is useful for assessing report graphics for exceptionally long studies.
Number at Risk Interval (days)
Enter the number of days comprising the block of time between study days where the number of subjects remaining in the study are reported.
Color Risk Table by Treatment
Use this option to color the numbers in the Risk Table by treatment.
Display
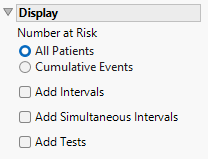
Number at Risk
Use this option to specify whether to calculate risk for all subjects or just those experiencing cumulative events. All Patients, which is set by default, displays the number of patients currently at risk in the analysis (i.e., those who have yet to have an event or be censored). Cumulative Events displays the number of patients who have experienced an event by the given time point.
Add Intervals
Check this option to show the 95% pointwise confidence bands for the Kaplan-Meier survival functions in the Survival Plot and the Failure Plot. Meeker and Escobar (1998, ch. 3) discuss pointwise and simultaneous confidence intervals and the motivation for simultaneous confidence intervals in survival analysis.
Add Simultaneous Intervals
Check this option to show the 95% simultaneous confidence bands for the Kaplan-Meier survival functions in the Survival Plot and the Failure Plot. Meeker and Escobar (1998, ch. 3) discuss pointwise and simultaneous confidence intervals and the motivation for simultaneous confidence intervals in survival analysis.
Add Tests
Check this option to add the Wilcoxon and Log-rank test p-values when two or more treatments are present.
General and Drill Down Buttons
Action buttons provide you with an easy way to drill down into your data. The following action buttons are generated by this report:
| • | Click  to rerun the report using default settings. to rerun the report using default settings. |
| • | Click  to view the associated data tables. Refer to Show Tables for more information. to view the associated data tables. Refer to Show Tables for more information. |
| • | Click  to generate a standardized PDF- or RTF-formatted report containing the plots and charts of selected sections. to generate a standardized PDF- or RTF-formatted report containing the plots and charts of selected sections. |
| • | Click  to generate a JMP Live report. Refer to Create Live Report for more information. to generate a JMP Live report. Refer to Create Live Report for more information. |
| • | Click  to take notes, and store them in a central location. Refer to Add Notes for more information. to take notes, and store them in a central location. Refer to Add Notes for more information. |
| • | Click  to read user-generated notes. Refer to View Notes for more information. to read user-generated notes. Refer to View Notes for more information. |
| • | Select one or more subjects, then click  to apply the Review Subject Filter and filter all reports in the review builder on the selected subjects. to apply the Review Subject Filter and filter all reports in the review builder on the selected subjects. |
| • | Select a group of subjects and click  to specify Derived Population Flags that enable you to distinguish the selected group of subjects from the general population. to specify Derived Population Flags that enable you to distinguish the selected group of subjects from the general population. |
Default Settings
Refer to Set Study Preferences for default Subject Level settings.
Methodology
This report assesses either progressive disease alone or in combination with deaths, depending on the option selected. Progressive disease is determined by the testing for the overall response where the result is PROGRESSIVE DISEASE or PD, where the study day (RSDY) is greater than or equal to 1. Deaths are determined using records from the disposition data set where the term (DSDECOD) is either DEATH, DEAD, or DIED and the study day (DSSTDY) is greater than or equal to 1. Subjects with missing censor date information are removed from the analysis. Notes are displayed at the top of the report for what censor date variable is used and how many subjects were removed due to missing censor date information.