Trellis Plot
A trellis plot (also known as a lattice plot or panel plot) is a group of smaller plots arranged in a grid. Each small plot represents a different condition or item, and all small plots share the same scales. Trellis plots make complex or high-dimensional data easier to interpret due to the common scales of small plots aligned in a grid, with each small plot containing a single difference compared to the others.
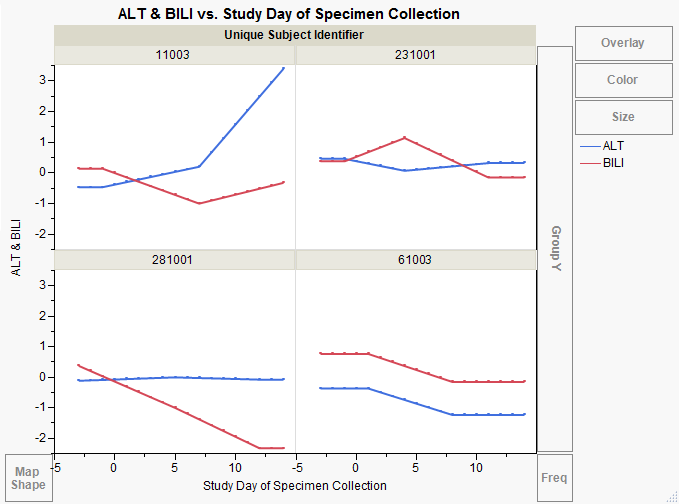
In the trellis plot shown above, the single difference between small plots is the subject (Unique Subject Identifier); ALT (blue) and BILI (red) can easily be contrasted both within and between subjects, over the time course of the study (Study Day of Specimen Collection).