The
Discontinuation of Kaplan-Meier Curves
process
plots the number of subjects still enrolled in the study versus days completed.
Running this report for
Nicardipine
using default settings generates the tabbed
Results
window shown below.
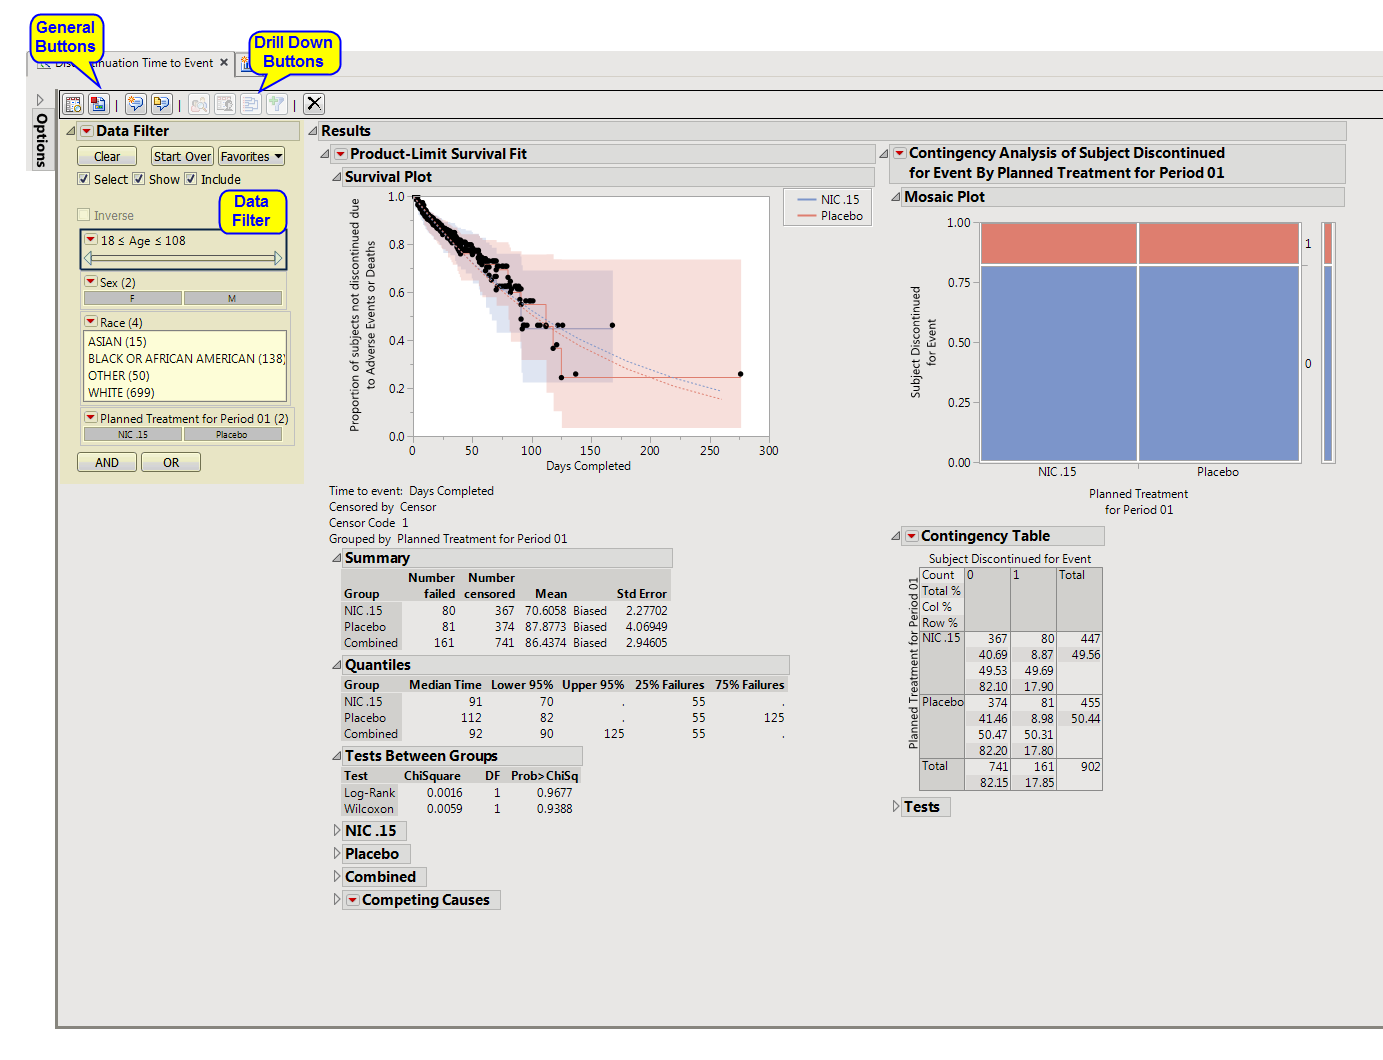
The
Report
window contains the following:
|
•
|
Data Filter
: This enables you to subset subjects based on demographic characteristics and other criteria. Refer to
Data Filter
for more information.
|
|
•
|
Results (Discontinuation Time to Event)
: This tab contains a
Kaplan-Meier
time-to-event analysis as well as a contingency analysis of treatment versus discontinuation status. You can define what constitutes a discontinuation using the
Define events as:
option in the
dialog
.
|
|
•
|
Profile Subjects
: Select subjects and click
|
|
•
|
Show Subjects
: Select subjects and click
|
|
•
|
Cluster Subjects
: Select subjects and click
|
|
•
|
Create Subject Filter
: Select subjects and click
|
|
•
|
Click
|
|
•
|
Click
|
|
•
|
Click
|
|
•
|
Click
|
|
•
|
Click the
arrow to reopen the completed dialog used to generate this output.
|