Running
Standardized MedDRA Queries Distribution
for the
Nicardipine
study using
MedDRA
Version 16.0 files generates the
Report
window shown below. Refer to the
Standardized MedDRA Queries Distribution
requirements description for more information.
Note
: Your output might vary depending on which version of MedDRA you provide (in terms of the location of the *.
asc
files).
The
Report
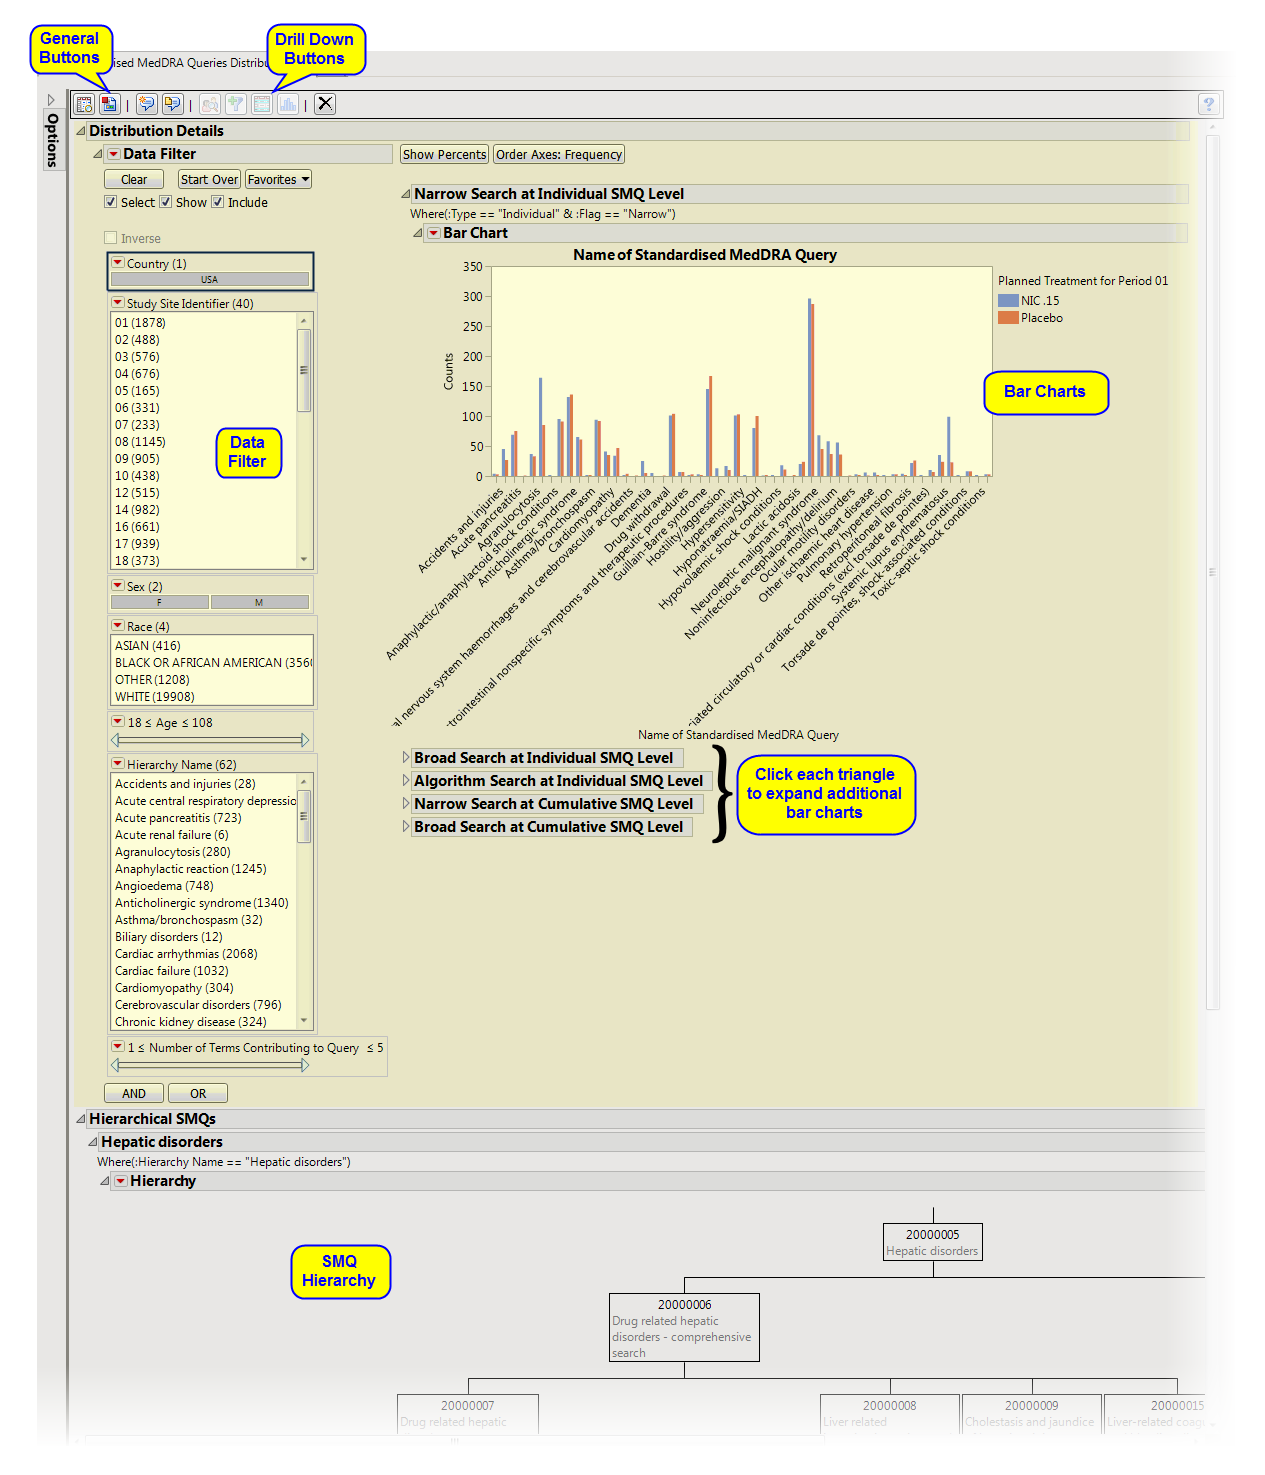
contains the following elements:
|
•
|
Distribution Details (SMQ Distribution)
: Provides
Bar Chart
s to summarize the frequency or percentage of major classes of
SMQs
by treatment.
|
|
•
|
Hierarchical SMQ’s
: Summarizes hierarchical SMQs graphically and provides observed and cumulative
sample sizes
and percentages of SMQs.
|
|
•
|
Profile Subjects
: Select subjects and click
|
|
•
|
Create Subject Filter
: Select subjects and click
|
|
•
|
Show SMQs
: Select SMQs from the plots and click
|
|
•
|
Show Events Leading to SMQs
: Select SMQs from the plots and click
|
|
•
|
Click
|
|
•
|
Click
|
|
•
|
Click
|
|
•
|
Click
|
|
•
|
Click the
arrow to reopen the completed process dialog used to generate this output.
|