This process compares
distributions
of Findings and demographic
variables
across treatment
arms
. Refer to the
Findings Distribution
requirements description for more information.
Note
: JMP Clinical employs a special protocol for data including non-unique Findings test names. Refer to
How does JMP Clinical handle non-unique Findings test names?
for more information.
Note
: Refer to
Distribution Reports
for a description of the general analysis performed by the JMP Clinical distribution reports.
Running
Findings Distribution
for
Nicardipine
using default settings generates the
Report
shown below.
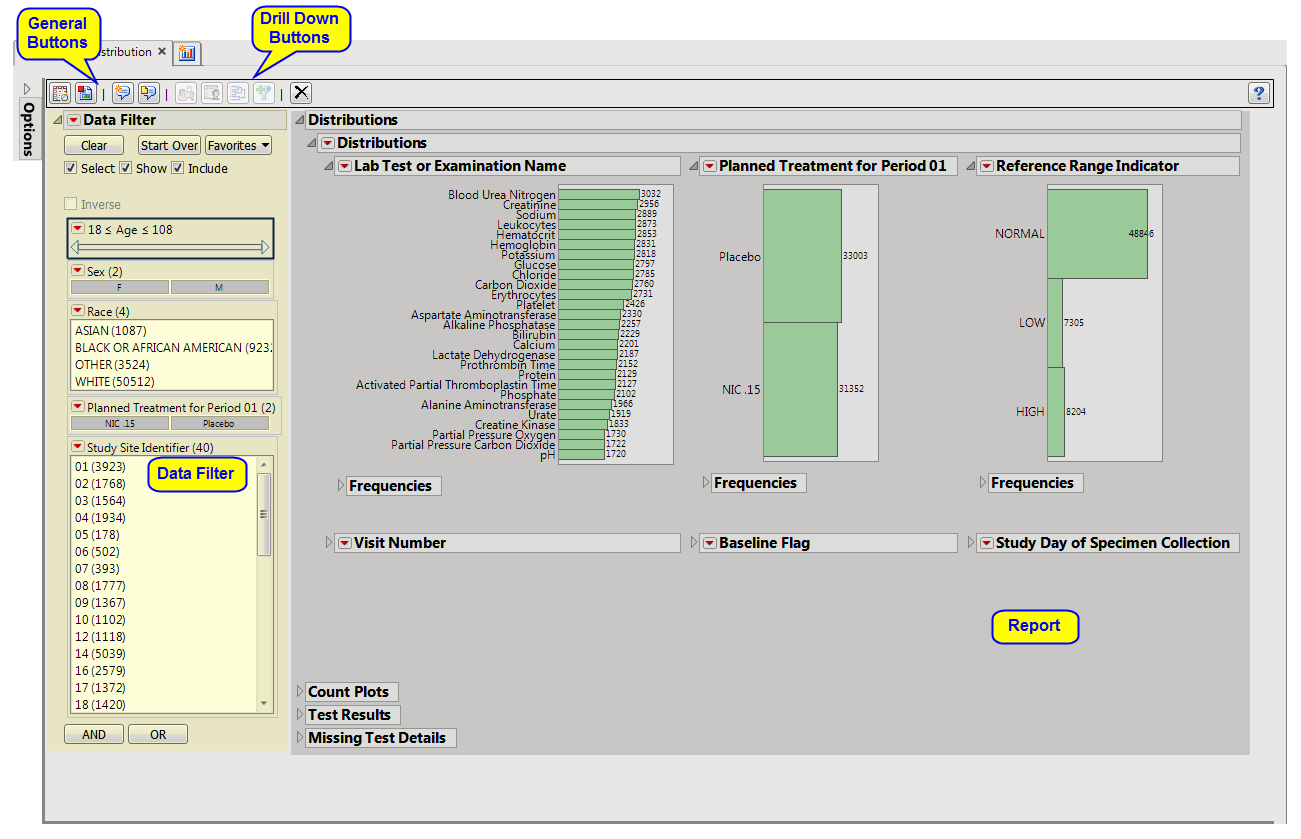
The
Report
contains the following sections:
|
•
|
Distributions
: Contains
Histogram
s
to display the
distribution
of Findings tests taken during the study and other relevant
variables
for the selected Findings domain.
|
|
•
|
Count Plots
: Contains graphs for each test to display measurement counts within categories of the Reference Range Indicator variable. This tab is displayed only if the
xxNRIND
variable is present in the Findings domain data (typically the
LB
domain).
|
|
•
|
Test Results
: Contains One-way Analyses (
ANOVA
) for each test that has numeric measurement results (
xxSTRESN
values), Contingency Analyses for each Findings test that has character results (
xxSTRESC
values but missing
xxSTRESN
values), or both.
|
|
•
|
Missing Test Details
: Contains tables displaying subject counts for tests that were either not recorded, or that were recorded but have missing measurement values (of
xxSTRESN
and/or
xxSTRESC
). If all subjects had
nonmissing
recorded test measurements for all tests, this tab is
not
shown.
|
This enables you to subset subjects based on demographic characteristics and study site. Refer to
Data Filter
for more information.
|
•
|
Profile Subjects
: Select subjects and click
|
|
•
|
Show Subjects
: Select subjects and click
|
|
•
|
Cluster Subjects
: Select subjects and click
|
|
•
|
Create Subject Filter
: Select subjects and click
|
|
•
|
Click
|
|
•
|
Click
|
|
•
|
Click
|
|
•
|
Click
|
|
•
|
Click the
arrow to reopen the completed process dialog used to generate this output.
|