This report displays the
box plots
by treatment group representing the change from baseline in measurements for each test for specified findings domain across various time windows or points in the study. Time windows can be specified using a list of bracketed times or, alternatively, a number of time windows can be set to create time windows that span across the entire study.
If the
variable
xxBLCHG
(where
xx
is substituted with the chosen domain 2 letter code) exists, this variable is used in plotting change from baseline. Otherwise, a measurement is determined to be a baseline measurement by the
ABLFL
or
xxBLFL
variable where
xx
is substituted with the 2 letter code for the chosen domain for analysis. If this variable does not exist, baseline is calculated from measurements taken on or before day 1 of the study. A time window can be specified to determine baseline measurements.
Refer to the
Findings Box Plots
requirements description for more information.
Note
: JMP Clinical employs a special protocol for data including non-unique Findings test names. Refer to
How does JMP Clinical handle non-unique Findings test names?
for more information.
Running
Findings Box Plots
for
Nicardipine
using default settings generates the report shown below. Refer to the
Findings Box Plots
requirements description for more information. Output from the process is organized into sections. Each tab contains one or more plots, data panels, data filters, or other elements that facilitate your analysis.
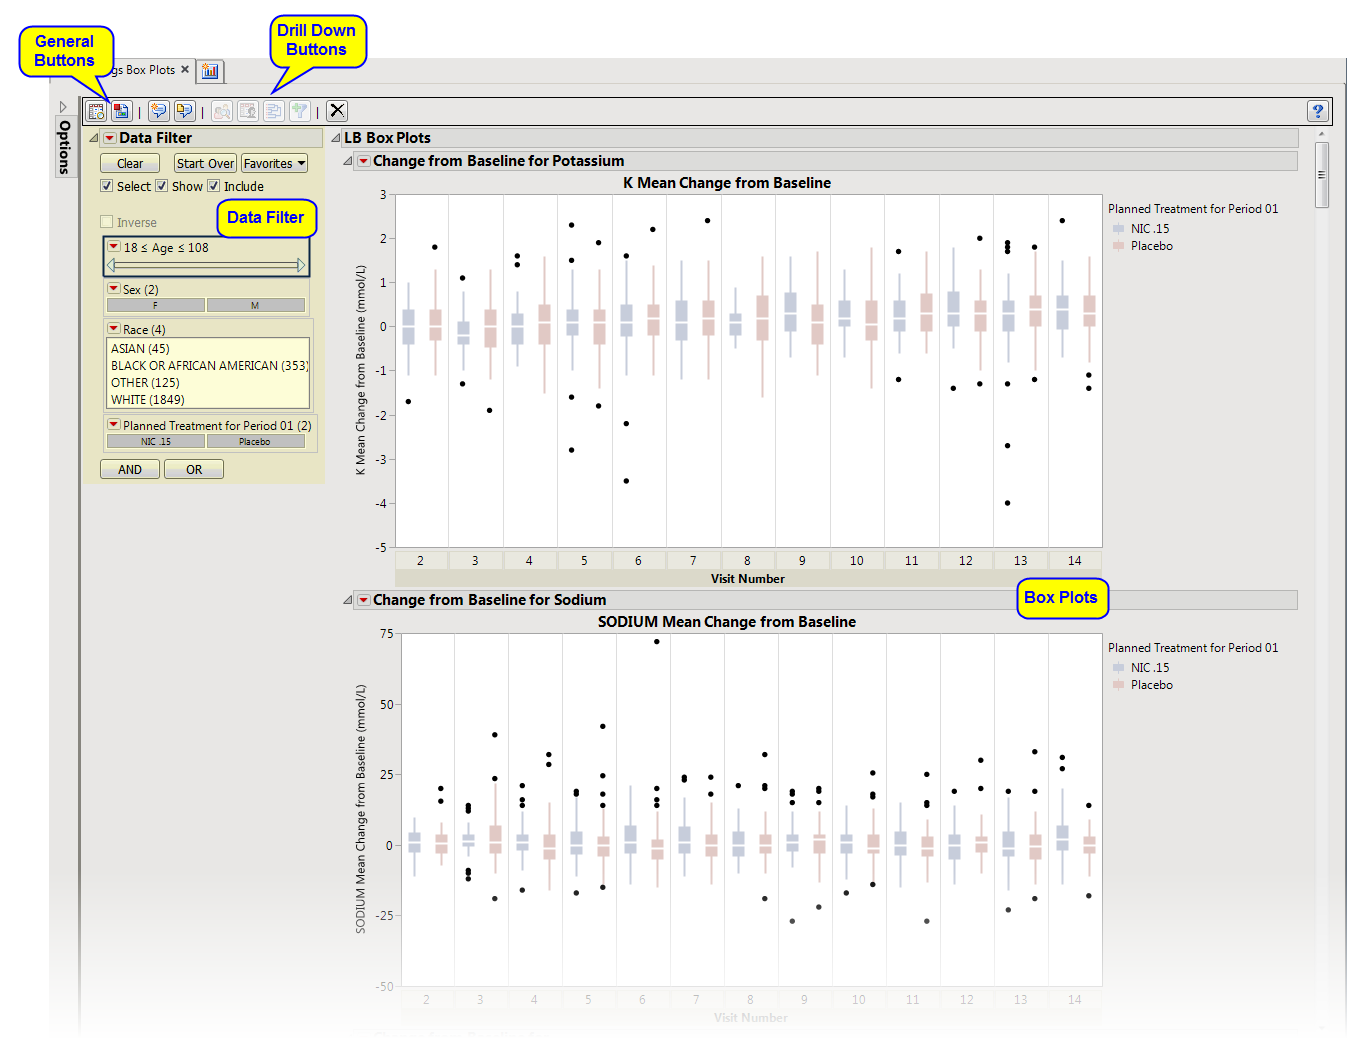
The
Report
window contains the following sections:
|
•
|
LB Box Plots
: This tab presents several
Box Plot
s
representing the values chosen in
Plot findings measurements as:
from the
dialog
. The name of this tab varies based on the domain chosen.
|
This enables you to subset subjects based on demographic characteristics and other factors. Refer to
Data Filter
for more information.
|
•
|
Profile Subjects
: Select subjects and click
|
|
•
|
Show Subjects
: Select subjects and click
|
|
•
|
Cluster Subjects
: Select subjects and click
|
|
•
|
Create Subject Filter
: Select subjects and click
|
|
•
|
Click
|
|
•
|
Click
|
|
•
|
Click
|
|
•
|
Click
|
|
•
|
Click the
arrow to reopen the completed process dialog used to generate this output.
|