This analysis visualizes peak values for lab measurements pertaining to
Hy’s Law
for detecting potential liver toxicity for all subjects across treatment
arms
. Lab measurements for Bilirubin (BILI), Alanine Aminotransferase (
ALT
), Aspartate Aminotransferase (AST), and Alkaline Phosphatase (ALP) are divided by the upper limit of normal (ULN) and displayed in a
scatterplot
matrix annotated with Hy's Law reference lines (2*ULN of BILI, 3*ULN of ALT).
Note
: As of JMP Clinical 4.1, you can specify that baseline reference values be used for Hy's Law screening instead of the traditional computation of values in reference to the Upper Limit of Normal (
ULN
).
This analysis also creates reports of the
distributions
of relevant liver test
variables
, tables of missing tests and categorized liver elevation levels, and displays of the peak liver test values by Study day.
Note
: JMP Clinical employs a special protocol for data including non-unique Findings test names. Refer to
How does JMP Clinical handle non-unique Findings test names?
for more information.
Refer to the
Hy’s Law Screening
requirements description for more information.
Running this process with the
Nicardipine
sample setting generates the report shown below.
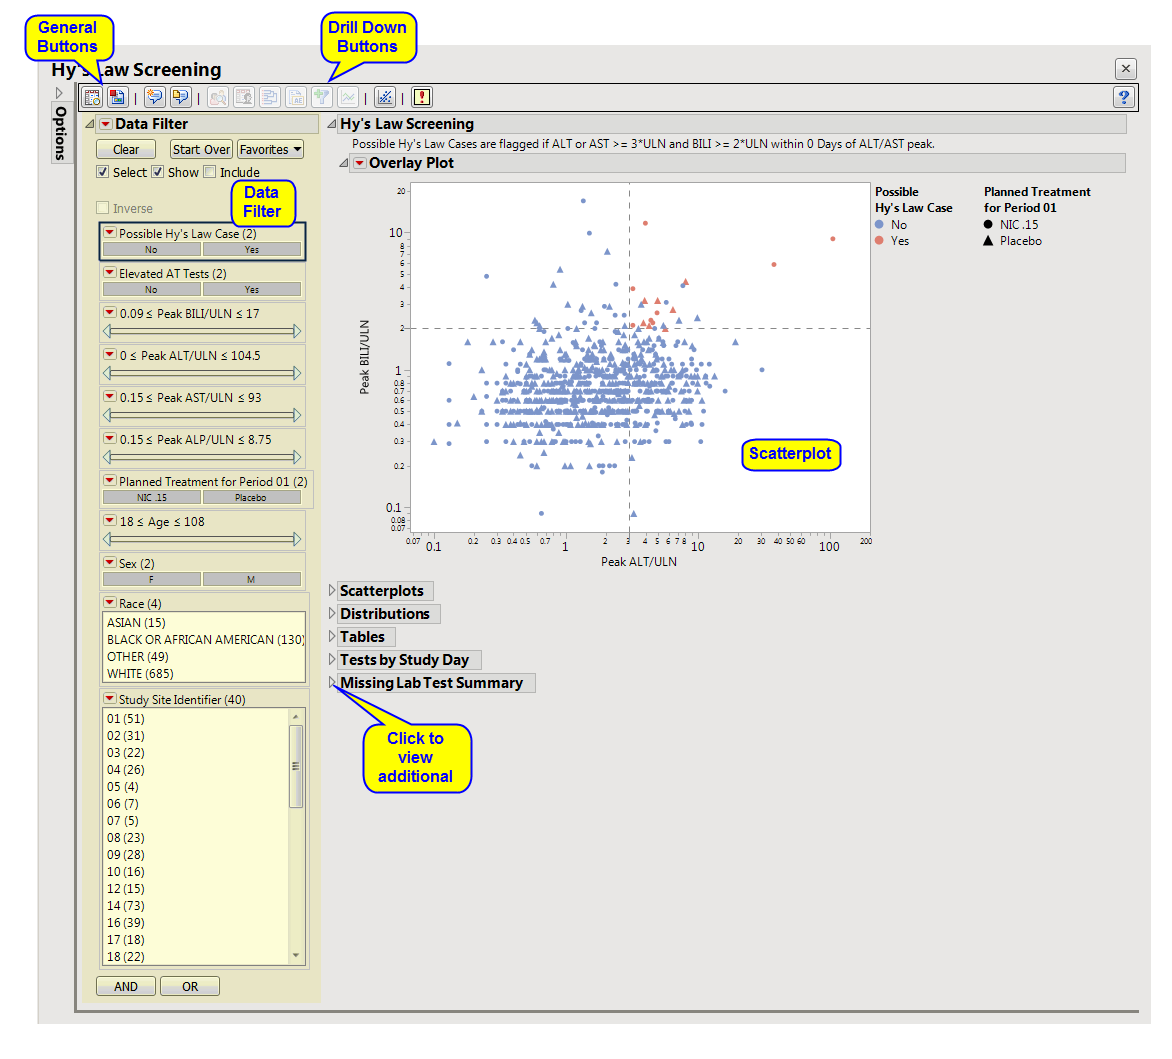
The
Report
contains the following elements:
|
•
|
Hy’s Law Screening
: This tab displays an overall
scatterplot
of peak
ALT
,
AST
,
BILI
, and
ALP
measurements across the study, with color used to flag subjects meeting Hy's Law criteria.
|
|
•
|
Scatterplots
: This tab displays scatterplots of peak
ALT
,
AST
,
BILI
, and
ALP
measurements across the study, with color used to flag subjects meeting Hy's Law criteria. Two contingency analyses show duration of Hy's Law and incidence of
ALT
or
AST
elevation by treatment.
|
|
•
|
Distributions (Hy’s Law Screening)
: This tab displays a set of histograms and summary statistics for the Hy's Law case counts, first day of Hy's Law events, AT test counts and first day of elevation along with demographics.
|
|
•
|
|
•
|
Tests by Study Day
: This tab contains a scatterplot matrix of four liver tests, plotting their peak values for each study day for each subject.
|
|
•
|
Missing Lab Test Summary
: This tab contains a table showing counts of subjects for which the relevant Hy's Law lab tests were
not
measured.
|
This enables you to subset your data based on demographics, test results, and/or study site. Refer to
Data Filter
for more information about how to use the
Data Filter
.
|
•
|
Profile Subjects
: Select subjects and click
|
|
•
|
Show Subjects
: Select subjects and click
|
|
•
|
Cluster Subjects
: Select subjects and click
|
|
•
|
Create Subject Filter
: Select subjects and click
|
|
•
|
Graph Time Profiles
: Select subjects and click
|
|
•
|
Liver Lab Shift Plots
: Click
|
|
•
|
Click
|
|
•
|
Click
|
|
•
|
Click
|
|
•
|
Click
|
|
•
|
Click the
arrow to reopen the completed process dialog used to generate this output.
|