This report creates waterfall plots to show the
distribution
of changes in test measurements for a given Findings domain across subjects (ordered by their magnitude of change). The Findings measurements are summarized based on a specified summary statistic and a waterfall plot is created for each Findings test.
Refer to the
Findings Waterfall Plots
requirements description for more information.
Note
: JMP Clinical employs a special protocol for data including non-unique Findings test names. Refer to
How does JMP Clinical handle non-unique Findings test names?
for more information.
Running
Findings Waterfall Plots
with the
Nicardipine
sample setting and
LB
findings domain generates the report shown below.
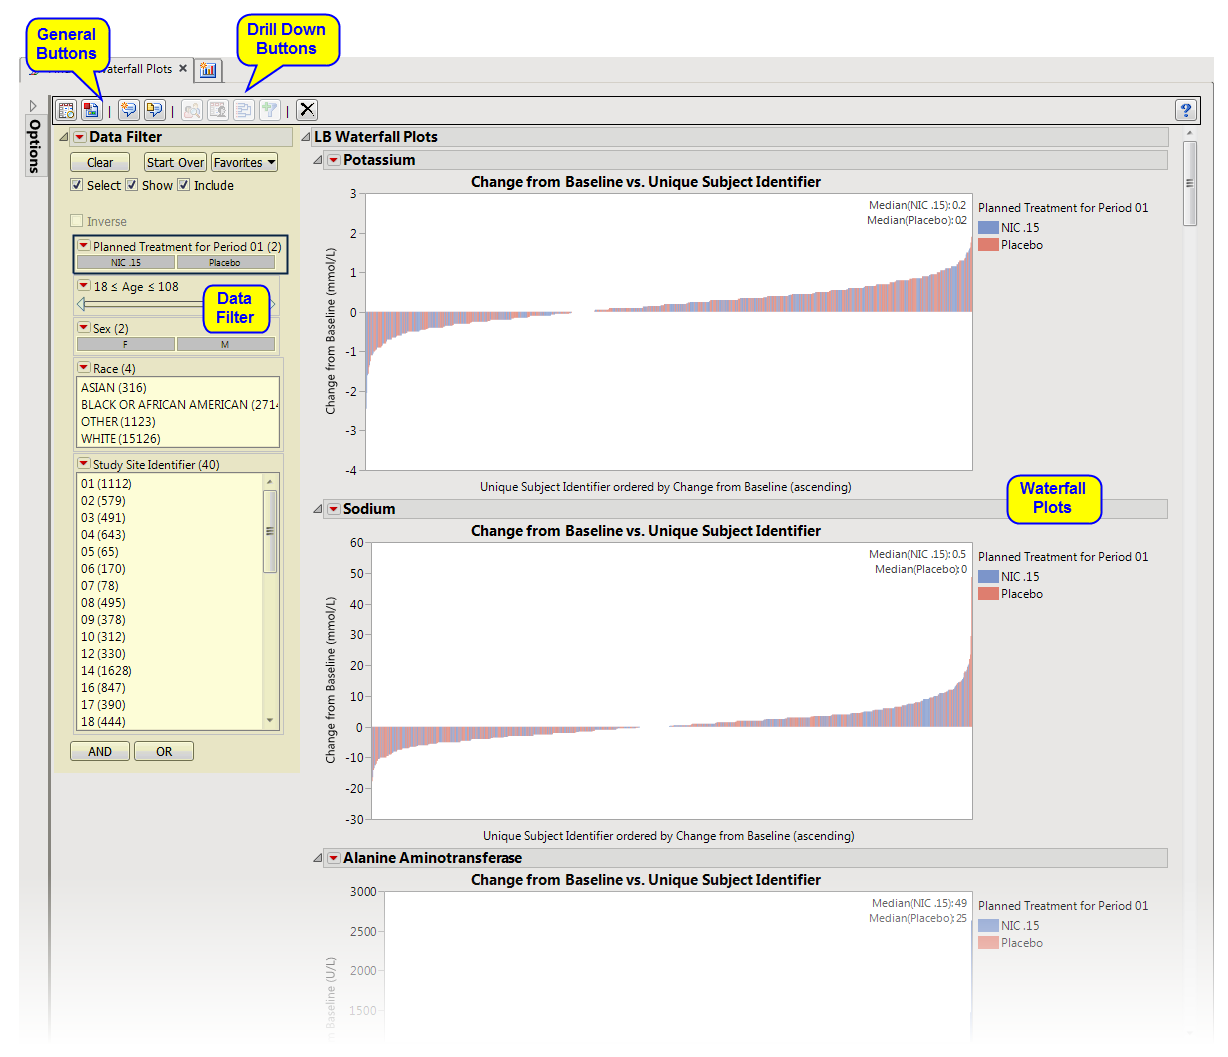
The
Report
contains the following elements:
|
•
|
Waterfall Plots
: There is one waterfall plot for each quantitative findings test (for example, laboratory tests) in the Findings data set that was analyzed. Output data set is a
stacked data set
of findings measurements at subject level; subject level drill downs available.
|
This enables you to subset subjects based on demographic characteristics and other factors. Refer to
Data Filter
for more information.
|
•
|
Profile Subjects
: Select subjects and click
|
|
•
|
Show Subjects
: Select subjects and click
|
|
•
|
Cluster Subjects
: Select subjects and click
|
|
•
|
Create Subject Filter
: Select subjects and click
|
|
•
|
Click
|
|
•
|
Click
|
|
•
|
Click
|
|
•
|
Click
|
|
•
|
Click the
arrow to reopen the completed process dialog used to generate this output.
|