Note
: JMP Clinical employs a special protocol for data including non-unique Findings test names. Refer to
How does JMP Clinical handle non-unique Findings test names?
for more information.
Running this report with the
Nicardipine
sample setting generates the report shown below.
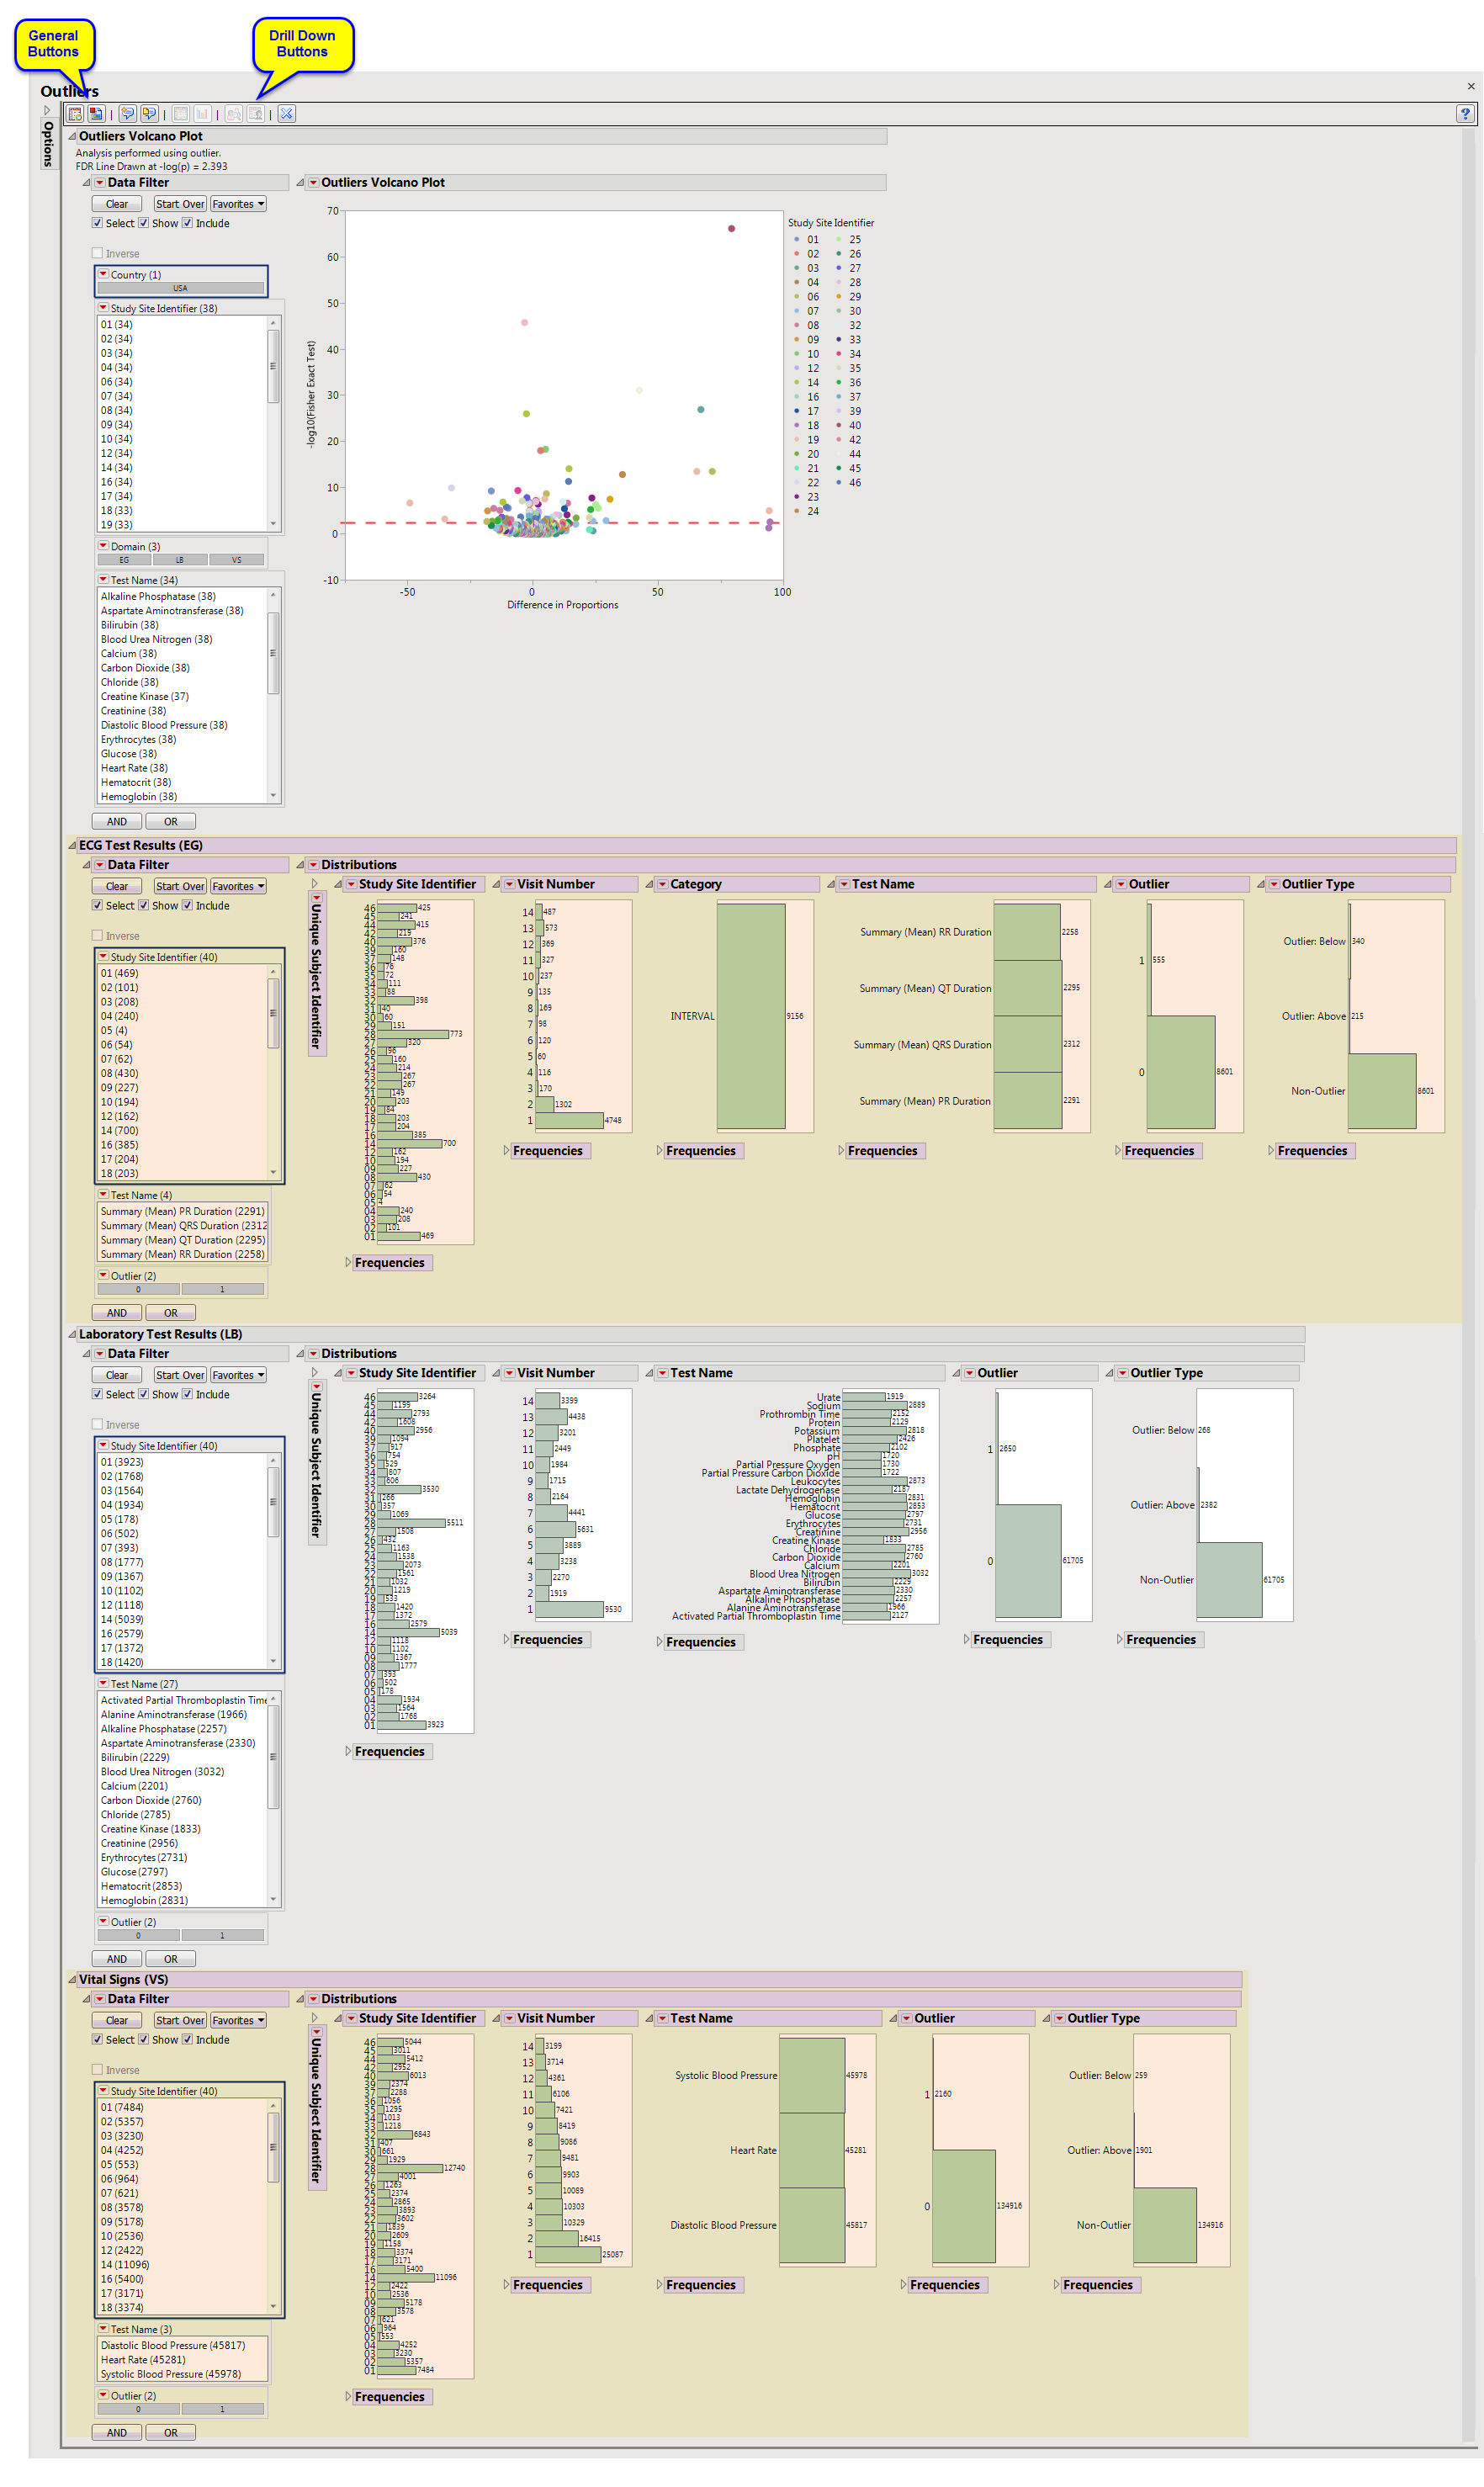
The
Report
contains the following elements:
|
•
|
Outliers Volcano Plot
: Shows a volcano plot used to determine the deviation of the proportion of outliers at each study site with the overall proportions for the whole study.
|
|
•
|
ECG Test Results (Outliers)
: Displays histograms showing distribution of ECG findings across study sites, tests, and visit numbers, as well as the frequencies and types of outliers.
|
|
•
|
Laboratory Test Results (Outliers)
: Displays histograms showing distribution of laboratory test findings across study sites, tests, and visit numbers, as well as the frequencies and types of outliers.
|
|
•
|
Vital Signs (Outliers)
: Displays histograms showing distribution of vital signs findings across study sites, tests, and visit numbers, as well as the frequencies and types of outliers.
|
|
•
|
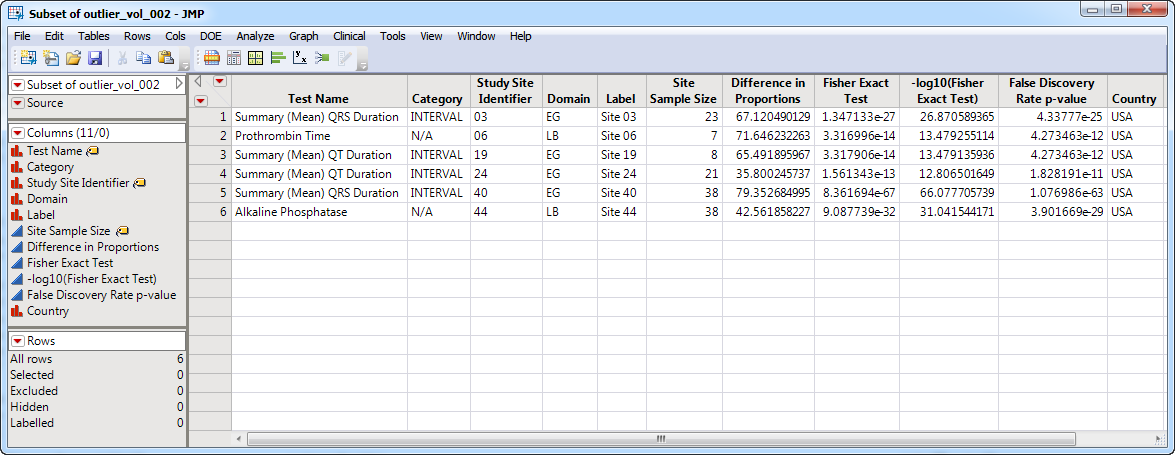
Show Sites
: Shows the rows of the data table for the selected points from the
volcano plot
. Clicking
|
|
•
|
Frequencies Barcharts
: Select points on the volcano plot and click
|
|
•
|
Profile Subjects
: Select subjects and click
|
|
•
|
Show Subjects
: Select subjects and click
|
|
•
|
Click
|
|
•
|
Click
|
|
•
|
Click
|
|
•
|
Click
|
|
•
|
Click the
arrow to reopen the completed process dialog used to generate this output.
|