Note
: JMP Clinical employs a special protocol for data including non-unique Findings test names. Refer to
How does JMP Clinical handle non-unique Findings test names?
for more information.
Note
:
xxTPT
should not have any visit specific information in it, or it is liable to prevent a match using BY variables.

The
Report
contains the following elements:
|
•
|
Screening Bias Volcano Plot
: Shows a volcano plot used to find records where findings change significantly between one visit and the next.
|
|
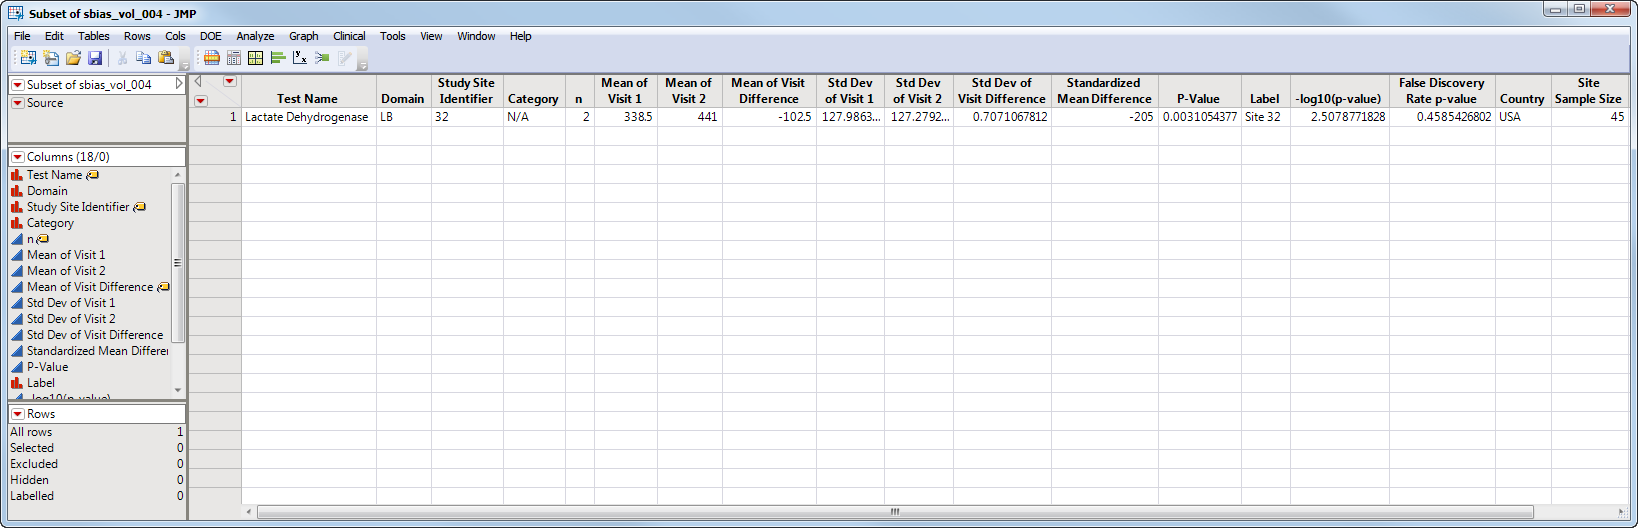
•
|
Show Summary Statistics
: Shows the rows of the data table for the selected points from the
volcano plot
. Clicking
|
|
•
|
Click
|
|
•
|
Click
|
|
•
|
Click
|
|
•
|
Click
|
|
•
|
Click the
arrow to reopen the completed process dialog used to generate this output.
|